
Note
Go to the end to download the full example code.
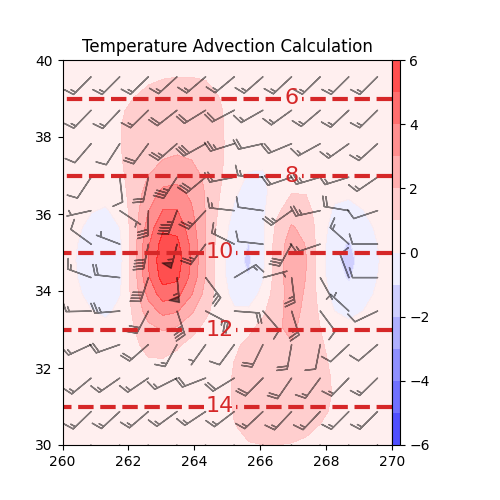
Advection#
Use metpy.calc.advection.
This example demonstrates the advection calculation by computing the temperature advection of the example xarray Dataset and plotting using Matplotlib.
/home/runner/work/MetPy/MetPy/examples/calculations/Advection.py:23: UserWarning: Vertical dimension number not found. Defaulting to (..., Z, Y, X) order.
  tadv = mpcalc.advection(ds.temperature, ds.uwind, ds.vwind)
kelvin / second
import matplotlib.pyplot as plt

import metpy.calc as mpcalc
from metpy.cbook import example_data

# load example data
ds = example_data()

# Calculate the temperature advection of the flow
tadv = mpcalc.advection(ds.temperature, ds.uwind, ds.vwind)

# See the units that come back from the advection function
print(tadv.data.units)

# start figure and set axis
fig, ax = plt.subplots(figsize=(5, 5))

# plot isotherms
cs = ax.contour(ds.lon, ds.lat, ds.temperature, range(4, 26, 2), colors='tab:red',
                linestyles='dashed', linewidths=3)
plt.clabel(cs, fmt='%d', fontsize=16)

# plot temperature advection and convert units to Kelvin per 3 hours
cf = ax.contourf(ds.lon, ds.lat, tadv.metpy.convert_units('kelvin/hour') * 3, range(-6, 7, 1),
                 cmap=plt.cm.bwr, alpha=0.75)
plt.colorbar(cf, pad=0, aspect=50)
ax.barbs(ds.lon.values[::2], ds.lat.values[::2],
         ds.uwind[::2, ::2], ds.vwind[::2, ::2],
         color='black', length=6, alpha=0.5)
ax.set(xlim=(260, 270), ylim=(30, 40))
ax.set_title('Temperature Advection Calculation')

plt.show()
Total running time of the script: (0 minutes 0.117 seconds)