
Note
Go to the end to download the full example code.
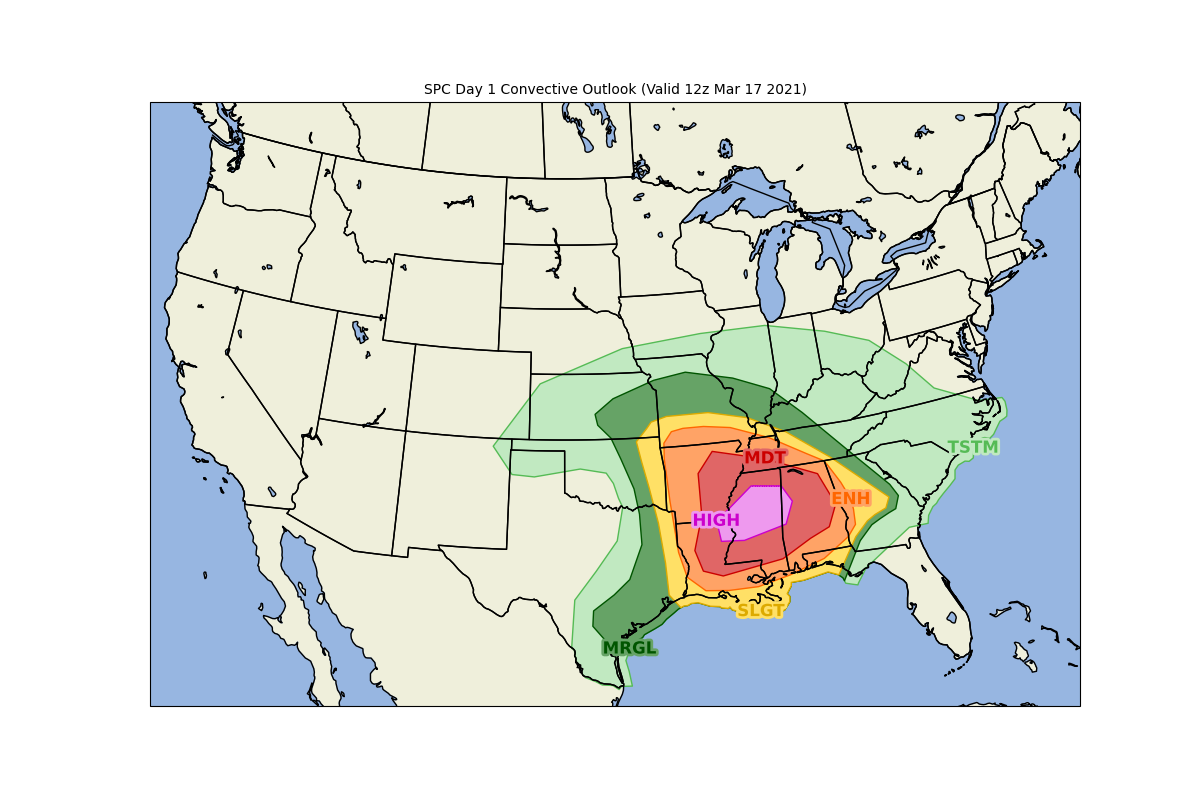
NOAA SPC Convective Outlook#
Demonstrate the use of geoJSON and shapefile data with PlotGeometry in MetPy’s simplified plotting interface. This example walks through plotting the Day 1 Convective Outlook from NOAA Storm Prediction Center. The geoJSON file was retrieved from the Storm Prediction Center’s archives.
import geopandas

from metpy.cbook import get_test_data
from metpy.plots import MapPanel, PanelContainer, PlotGeometry
Read in the geoJSON file containing the convective outlook.
day1_outlook = geopandas.read_file(get_test_data('spc_day1otlk_20210317_1200_lyr.geojson'))
Preview the data.
day1_outlook
Plot the shapes from the ‘geometry’ column. Give the shapes their fill and stroke color by providing the ‘fill’ and ‘stroke’ columns. Use text from the ‘LABEL’ column as labels for the shapes.
geo = PlotGeometry()
geo.geometry = day1_outlook['geometry']
geo.fill = day1_outlook['fill']
geo.stroke = day1_outlook['stroke']
geo.labels = day1_outlook['LABEL']
geo.label_fontsize = 'large'
Add the geometry plot to a panel and container.
panel = MapPanel()
panel.title = 'SPC Day 1 Convective Outlook (Valid 12z Mar 17 2021)'
panel.plots = [geo]
panel.area = [-120, -75, 25, 50]
panel.projection = 'lcc'
panel.layers = ['lakes', 'land', 'ocean', 'states', 'coastline', 'borders']

pc = PanelContainer()
pc.size = (12, 8)
pc.panels = [panel]
pc.show()
Total running time of the script: (0 minutes 6.586 seconds)