
Note
Go to the end to download the full example code.
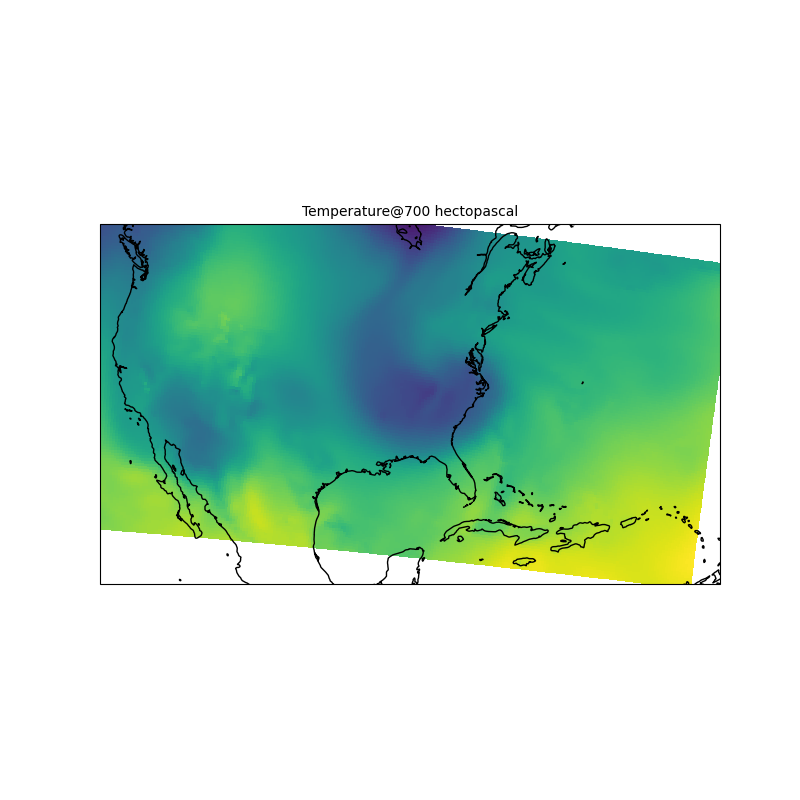
Raster Plots using Declarative Syntax#
The MetPy declarative syntax allows for a simplified interface to creating common meteorological analyses including surface observation plots. This example creates a temperature raster plot, though other potential raster plots include radar.
import xarray as xr

from metpy.cbook import get_test_data
from metpy.plots import MapPanel, PanelContainer, RasterPlot
from metpy.units import units
Import the temperature data from the NARR file.
narr_data = xr.open_dataset(get_test_data('narr_example.nc', as_file_obj=False))
Preview the data:
<xarray.Dataset> Size: 21MB
Dimensions:              (time: 1, isobaric: 29, y: 118, x: 292)
Coordinates:
  * time                 (time) datetime64[ns] 8B 1987-04-04T18:00:00
  * isobaric             (isobaric) float64 232B 1e+03 975.0 ... 125.0 100.0
  * y                    (y) float64 944B -3.087e+03 -3.054e+03 ... 678.9 711.4
  * x                    (x) float64 2kB -3.977e+03 -3.945e+03 ... 5.47e+03
Data variables:
    Temperature          (time, isobaric, y, x) float32 4MB ...
    Lambert_Conformal    |S1 1B ...
    lat                  (y, x) float64 276kB ...
    lon                  (y, x) float64 276kB ...
    u_wind               (time, isobaric, y, x) float32 4MB ...
    v_wind               (time, isobaric, y, x) float32 4MB ...
    Geopotential_height  (time, isobaric, y, x) float32 4MB ...
    Specific_humidity    (time, isobaric, y, x) float32 4MB ...
Attributes: (12/14)
    Conventions:              CF-1.0
    Originating_center:       US National Weather Service - NCEP(WMC) (7)
    Originating_subcenter:    The North American Regional Reanalysis (NARR) P...
    Generating_Model:         North American Regional Reanalysis (NARR)
    Product_Type:             Forecast/Uninitialized Analysis/Image Product
    title:                    US National Weather Service - NCEP(WMC) North A...
    ...                       ...
    history:                  Direct read of GRIB-1 into NetCDF-Java 4 API
    CF:feature_type:          GRID
    file_format:              GRIB-1
    location:                 /nomads3_data/raid2/noaaport/merged/narr/198704...
    _CoordinateModelRunDate:  1987-04-04T18:00:00Z
    History:                  Translated to CF-1.0 Conventions by Netcdf-Java...
xarray.Dataset
- time: 1
- isobaric: 29
- y: 118
- x: 292
- time(time)datetime64[ns]1987-04-04T18:00:00
- long_name :
- forecast time
- _CoordinateAxisType :
- Time
array(['1987-04-04T18:00:00.000000000'], dtype='datetime64[ns]')
- isobaric(isobaric)float641e+03 975.0 950.0 ... 125.0 100.0
- long_name :
- Isobaric surface
- units :
- hPa
- positive :
- down
- GRIB_level_type :
- 100
- _CoordinateAxisType :
- Pressure
- _CoordinateZisPositive :
- down
array([1000., 975., 950., 925., 900., 875., 850., 825., 800., 775., 750., 725., 700., 650., 600., 550., 500., 450., 400., 350., 300., 275., 250., 225., 200., 175., 150., 125., 100.]) - y(y)float64-3.087e+03 -3.054e+03 ... 711.4
- units :
- km
- long_name :
- y coordinate of projection
- standard_name :
- projection_y_coordinate
- grid_spacing :
- 32.463 km
- _CoordinateAxisType :
- GeoY
array([-3.086806e+03, -3.054343e+03, -3.021880e+03, -2.989417e+03, -2.956954e+03, -2.924491e+03, -2.892028e+03, -2.859565e+03, -2.827102e+03, -2.794639e+03, -2.762176e+03, -2.729713e+03, -2.697250e+03, -2.664787e+03, -2.632324e+03, -2.599861e+03, -2.567398e+03, -2.534935e+03, -2.502472e+03, -2.470009e+03, -2.437546e+03, -2.405083e+03, -2.372620e+03, -2.340157e+03, -2.307694e+03, -2.275231e+03, -2.242768e+03, -2.210305e+03, -2.177842e+03, -2.145379e+03, -2.112916e+03, -2.080453e+03, -2.047990e+03, -2.015527e+03, -1.983064e+03, -1.950601e+03, -1.918138e+03, -1.885675e+03, -1.853212e+03, -1.820749e+03, -1.788286e+03, -1.755823e+03, -1.723360e+03, -1.690897e+03, -1.658434e+03, -1.625971e+03, -1.593508e+03, -1.561045e+03, -1.528582e+03, -1.496119e+03, -1.463656e+03, -1.431193e+03, -1.398730e+03, -1.366267e+03, -1.333804e+03, -1.301341e+03, -1.268878e+03, -1.236415e+03, -1.203952e+03, -1.171489e+03, -1.139026e+03, -1.106563e+03, -1.074100e+03, -1.041637e+03, -1.009174e+03, -9.767106e+02, -9.442476e+02, -9.117846e+02, -8.793216e+02, -8.468586e+02, -8.143956e+02, -7.819326e+02, -7.494696e+02, -7.170066e+02, -6.845436e+02, -6.520806e+02, -6.196176e+02, -5.871546e+02, -5.546916e+02, -5.222286e+02, -4.897656e+02, -4.573026e+02, -4.248396e+02, -3.923766e+02, -3.599136e+02, -3.274506e+02, -2.949876e+02, -2.625246e+02, -2.300616e+02, -1.975986e+02, -1.651356e+02, -1.326726e+02, -1.002096e+02, -6.774665e+01, -3.528365e+01, -2.820646e+00, 2.964235e+01, 6.210535e+01, 9.456835e+01, 1.270314e+02, 1.594944e+02, 1.919574e+02, 2.244204e+02, 2.568834e+02, 2.893464e+02, 3.218094e+02, 3.542724e+02, 3.867354e+02, 4.191984e+02, 4.516614e+02, 4.841244e+02, 5.165874e+02, 5.490504e+02, 5.815134e+02, 6.139764e+02, 6.464394e+02, 6.789024e+02, 7.113654e+02]) - x(x)float64-3.977e+03 -3.945e+03 ... 5.47e+03
- units :
- km
- long_name :
- x coordinate of projection
- standard_name :
- projection_x_coordinate
- grid_spacing :
- 32.463 km
- _CoordinateAxisType :
- GeoX
array([-3977.054864, -3944.591864, -3912.128864, ...,  5404.752136,
        5437.215136,  5469.678136], shape=(292,))
- Temperature(time, isobaric, y, x)float32...
- units :
- K
- long_name :
- Temperature @ isobaric
- grid_mapping :
- Lambert_Conformal
- GRIB_param_name :
- Temperature
- GRIB_param_short_name :
- TMP
- GRIB_center_id :
- 7
- GRIB_table_id :
- 131
- GRIB_param_number :
- 11
- GRIB_param_id :
- [ 1 7 131 11]
- GRIB_product_definition_type :
- Initialized analysis product
- GRIB_level_type :
- 100
- GRIB_VectorComponentFlag :
- gridRelative
[999224 values with dtype=float32]
- Lambert_Conformal()|S1...
- grid_mapping_name :
- lambert_conformal_conic
- standard_parallel :
- 50.0
- longitude_of_central_meridian :
- -107.0
- latitude_of_projection_origin :
- 50.0
- earth_shape :
- spherical
- earth_radius :
- 6367470.21484375
- GRIB_param_Dx :
- 32463.0
- GRIB_param_Dy :
- 32463.0
- GRIB_param_GDSkey :
- 55295
- GRIB_param_La1 :
- 1.0
- GRIB_param_Latin1 :
- 50.0
- GRIB_param_Latin2 :
- 50.0
- GRIB_param_Lo1 :
- -145.5
- GRIB_param_LoV :
- -107.0
- GRIB_param_NpProj :
- true
- GRIB_param_Nx :
- 349
- GRIB_param_Ny :
- 277
- GRIB_param_ProjFlag :
- 0
- GRIB_param_ResCompFlag :
- 8
- GRIB_param_SpLat :
- 0.0
- GRIB_param_SpLon :
- 0.0
- GRIB_param_VectorComponentFlag :
- gridRelative
- GRIB_param_Winds :
- Relative
- GRIB_param_grid_name :
- Lambert_Conformal
- GRIB_param_grid_radius_spherical_earth :
- 6367.47
- GRIB_param_grid_shape :
- spherical
- GRIB_param_grid_shape_code :
- 0
- GRIB_param_grid_type :
- 3
- GRIB_param_grid_units :
- m
- GRIB_param_scanning_mode :
- 64
- _CoordinateTransformType :
- Projection
- _CoordinateAxisTypes :
- GeoX GeoY
[1 values with dtype=|S1]
- lat(y, x)float64...
- units :
- degrees_north
- long_name :
- latitude coordinate
- standard_name :
- latitude
- _CoordinateAxisType :
- Lat
[34456 values with dtype=float64]
- lon(y, x)float64...
- units :
- degrees_east
- long_name :
- longitude coordinate
- standard_name :
- longitude
- _CoordinateAxisType :
- Lon
[34456 values with dtype=float64]
- u_wind(time, isobaric, y, x)float32...
- units :
- m/s
- long_name :
- u_wind @ isobaric
- grid_mapping :
- Lambert_Conformal
- GRIB_param_name :
- u_wind
- GRIB_param_short_name :
- UGRD
- GRIB_center_id :
- 7
- GRIB_table_id :
- 131
- GRIB_param_number :
- 33
- GRIB_param_id :
- [ 1 7 131 33]
- GRIB_product_definition_type :
- Initialized analysis product
- GRIB_level_type :
- 100
- GRIB_VectorComponentFlag :
- gridRelative
[999224 values with dtype=float32]
- v_wind(time, isobaric, y, x)float32...
- units :
- m/s
- long_name :
- v_wind @ isobaric
- grid_mapping :
- Lambert_Conformal
- GRIB_param_name :
- v_wind
- GRIB_param_short_name :
- VGRD
- GRIB_center_id :
- 7
- GRIB_table_id :
- 131
- GRIB_param_number :
- 34
- GRIB_param_id :
- [ 1 7 131 34]
- GRIB_product_definition_type :
- Initialized analysis product
- GRIB_level_type :
- 100
- GRIB_VectorComponentFlag :
- gridRelative
[999224 values with dtype=float32]
- Geopotential_height(time, isobaric, y, x)float32...
- units :
- gpm
- long_name :
- Geopotential_height @ isobaric
- grid_mapping :
- Lambert_Conformal
- GRIB_param_name :
- Geopotential_height
- GRIB_param_short_name :
- HGT
- GRIB_center_id :
- 7
- GRIB_table_id :
- 131
- GRIB_param_number :
- 7
- GRIB_param_id :
- [ 1 7 131 7]
- GRIB_product_definition_type :
- Initialized analysis product
- GRIB_level_type :
- 100
- GRIB_VectorComponentFlag :
- gridRelative
[999224 values with dtype=float32]
- Specific_humidity(time, isobaric, y, x)float32...
- units :
- kg/kg
- long_name :
- Specific_humidity @ isobaric
- grid_mapping :
- Lambert_Conformal
- GRIB_param_name :
- Specific_humidity
- GRIB_param_short_name :
- SPFH
- GRIB_center_id :
- 7
- GRIB_table_id :
- 131
- GRIB_param_number :
- 51
- GRIB_param_id :
- [ 1 7 131 51]
- GRIB_product_definition_type :
- Initialized analysis product
- GRIB_level_type :
- 100
- GRIB_VectorComponentFlag :
- gridRelative
[999224 values with dtype=float32]
- timePandasIndex
PandasIndex(DatetimeIndex(['1987-04-04 18:00:00'], dtype='datetime64[ns]', name='time', freq=None))
- isobaricPandasIndex
PandasIndex(Index([1000.0, 975.0, 950.0, 925.0, 900.0, 875.0, 850.0, 825.0, 800.0, 775.0, 750.0, 725.0, 700.0, 650.0, 600.0, 550.0, 500.0, 450.0, 400.0, 350.0, 300.0, 275.0, 250.0, 225.0, 200.0, 175.0, 150.0, 125.0, 100.0], dtype='float64', name='isobaric')) - yPandasIndex
PandasIndex(Index([-3086.8056464496035, -3054.3426464496033, -3021.8796464496036, -2989.4166464496034, -2956.953646449603, -2924.4906464496034, -2892.0276464496037, -2859.5646464496035, -2827.1016464496033, -2794.6386464496036, ... 419.19835355039686, 451.6613535503966, 484.12435355039634, 516.587353550397, 549.0503535503967, 581.5133535503965, 613.9763535503971, 646.4393535503968, 678.9023535503966, 711.3653535503963], dtype='float64', name='y', length=118)) - xPandasIndex
PandasIndex(Index([ -3977.054863757302, -3944.5918637573022, -3912.1288637573025,
       -3879.6658637573023,  -3847.202863757302, -3814.7398637573024,
        -3782.276863757302,  -3749.813863757302, -3717.3508637573022,
       -3684.8878637573025,
       ...
         5177.511136242698,   5209.974136242698,   5242.437136242697,
         5274.900136242699,   5307.363136242699,   5339.826136242698,
         5372.289136242698,   5404.752136242698,   5437.215136242698,
         5469.678136242697],
      dtype='float64', name='x', length=292))
- Conventions :
- CF-1.0
- Originating_center :
- US National Weather Service - NCEP(WMC) (7)
- Originating_subcenter :
- The North American Regional Reanalysis (NARR) Project (15)
- Generating_Model :
- North American Regional Reanalysis (NARR)
- Product_Type :
- Forecast/Uninitialized Analysis/Image Product
- title :
- US National Weather Service - NCEP(WMC) North American Regional Reanalysis (NARR) Forecast/Uninitialized Analysis/Image Product
- institution :
- Center US National Weather Service - NCEP(WMC) (7) Subcenter The North American Regional Reanalysis (NARR) Project (15)
- source :
- Forecast/Uninitialized Analysis/Image Product
- history :
- Direct read of GRIB-1 into NetCDF-Java 4 API
- CF:feature_type :
- GRID
- file_format :
- GRIB-1
- location :
- /nomads3_data/raid2/noaaport/merged/narr/198704/19870404/narr-a_221_19870404_1800_000.grb
- _CoordinateModelRunDate :
- 1987-04-04T18:00:00Z
- History :
- Translated to CF-1.0 Conventions by Netcdf-Java CDM (NetcdfCFWriter) Original Dataset = narr-a/198704/19870404/narr-a_221_19870404_1800_000.grb; Translation Date = Fri Jun 16 13:26:21 EDT 2017
Create the ‘RasterPlot’ object and provide it with the NARR data. Specify the level to be plotted, and use the Data variables column to specify the data field to be plotted.
raster = RasterPlot()
raster.data = narr_data
raster.field = 'Temperature'
raster.level = 700 * units.hPa
Add the plot to a Map Panel and Panel Container.
panel = MapPanel()
panel.area = 'us'
panel.projection = 'lcc'
panel.layers = ['coastline']
panel.plots = [raster]

pc = PanelContainer()
pc.size = (8, 8)
pc.panels = [panel]
pc.draw()

pc.show()
Total running time of the script: (0 minutes 0.718 seconds)