
Note
Go to the end to download the full example code.
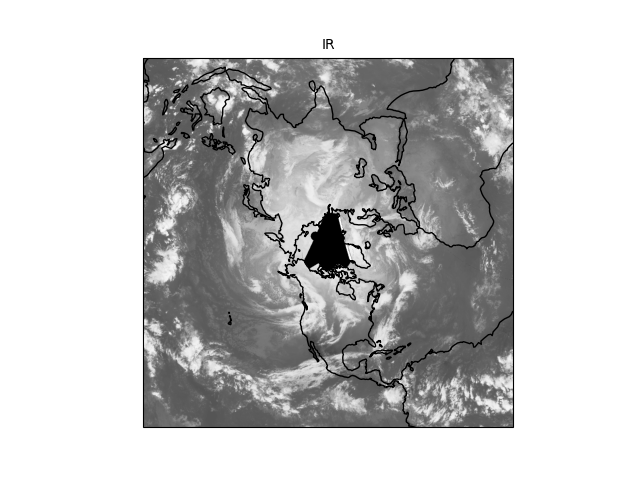
Simple Plotting#
Demonstrate the use of MetPy’s simplified plotting interface.
Plots a sample satellite image file.
Adjusting bad PDB size from 0 to 512.
import xarray as xr

from metpy.cbook import get_test_data
from metpy.io import GiniFile
from metpy.plots import ImagePlot, MapPanel, PanelContainer

data = xr.open_dataset(GiniFile(get_test_data('NHEM-MULTICOMP_1km_IR_20151208_2100.gini')))

img = ImagePlot()
img.data = data
img.field = 'IR'
img.colormap = 'Greys_r'

panel = MapPanel()
panel.plots = [img]

pc = PanelContainer()
pc.panels = [panel]
pc.show()
Total running time of the script: (0 minutes 0.509 seconds)