
Note
Go to the end to download the full example code.
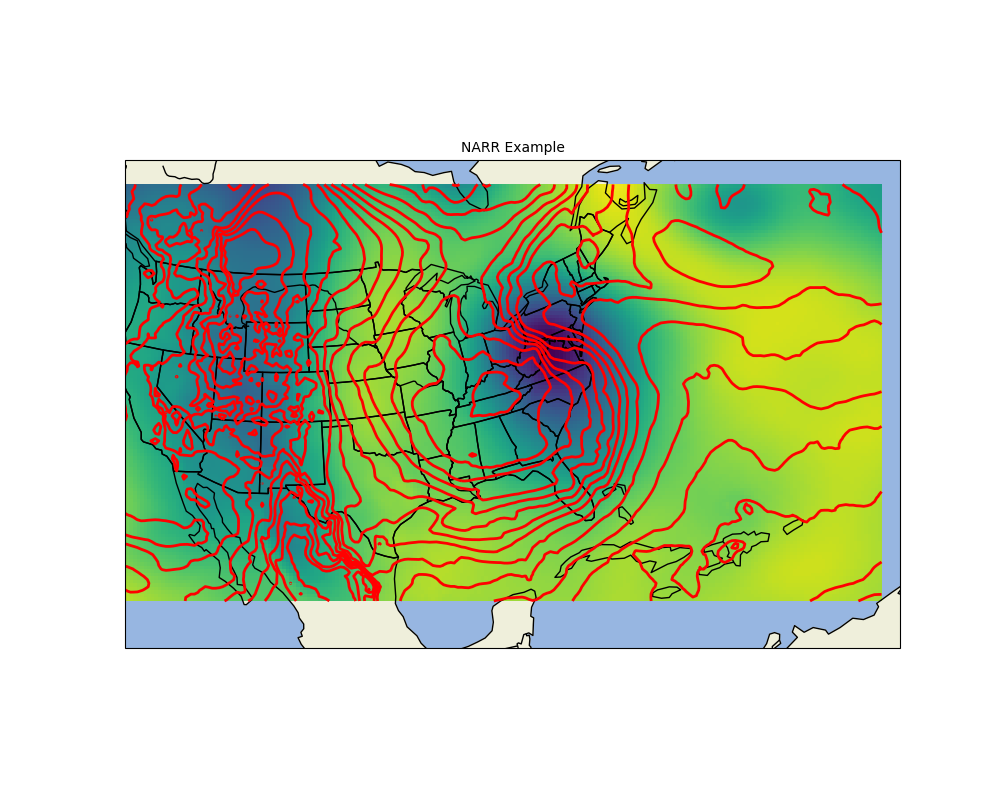
Combined Plotting#
Demonstrate the use of MetPy’s simplified plotting interface combining multiple plots.
Also shows how to control the maps that are plotted. Plots sample NARR data.
import xarray as xr

from metpy.cbook import get_test_data
from metpy.plots import ContourPlot, ImagePlot, MapPanel, PanelContainer
from metpy.units import units

# Use sample NARR data for plotting
narr = xr.open_dataset(get_test_data('narr_example.nc', as_file_obj=False))
Create a contour plot of temperature
contour = ContourPlot()
contour.data = narr
contour.field = 'Temperature'
contour.level = 850 * units.hPa
contour.linecolor = 'red'
contour.contours = 15
Create an image plot of Geopotential height
Plot the data on a map
panel = MapPanel()
panel.area = 'us'
panel.layers = ['coastline', 'borders', 'states', 'rivers', 'ocean', 'land']
panel.title = 'NARR Example'
panel.plots = [contour, img]

pc = PanelContainer()
pc.size = (10, 8)
pc.panels = [panel]
pc.show()
Total running time of the script: (0 minutes 5.319 seconds)