
Note
Go to the end to download the full example code.
Wind and Sea Level Pressure Interpolation#
Interpolate sea level pressure, as well as wind component data, to make a consistent looking analysis, featuring contours of pressure and wind barbs.
import cartopy.crs as ccrs
import cartopy.feature as cfeature
from matplotlib.colors import BoundaryNorm
import matplotlib.pyplot as plt
import numpy as np
import pandas as pd

from metpy.calc import wind_components
from metpy.cbook import get_test_data
from metpy.interpolate import interpolate_to_grid, remove_nan_observations
from metpy.plots import add_metpy_logo
from metpy.units import units

to_proj = ccrs.AlbersEqualArea(central_longitude=-97., central_latitude=38.)
Read in data
with get_test_data('station_data.txt') as f:
    data = pd.read_csv(f, header=0, usecols=(2, 3, 4, 5, 18, 19),
                       names=['latitude', 'longitude', 'slp', 'temperature', 'wind_dir',
                              'wind_speed'],
                       na_values=-99999)
Project the lon/lat locations to our final projection
Remove all missing data from pressure
Interpolate pressure using Cressman interpolation
Get wind information and mask where either speed or direction is unavailable
wind_speed = (data['wind_speed'].values * units('m/s')).to('knots')
wind_dir = data['wind_dir'].values * units.degree

good_indices = np.where((~np.isnan(wind_dir)) & (~np.isnan(wind_speed)))

x_masked = xp[good_indices]
y_masked = yp[good_indices]
wind_speed = wind_speed[good_indices]
wind_dir = wind_dir[good_indices]
Calculate u and v components of wind and then interpolate both.
Both will have the same underlying grid so throw away grid returned from v interpolation.
u, v = wind_components(wind_speed, wind_dir)

windgridx, windgridy, uwind = interpolate_to_grid(x_masked, y_masked, np.array(u),
                                                  interp_type='cressman', search_radius=400000,
                                                  hres=100000)

_, _, vwind = interpolate_to_grid(x_masked, y_masked, np.array(v), interp_type='cressman',
                                  search_radius=400000, hres=100000)
/home/runner/work/MetPy/MetPy/examples/gridding/Wind_SLP_Interpolation.py:69: DeprecationWarning: __array__ implementation doesn't accept a copy keyword, so passing copy=False failed. __array__ must implement 'dtype' and 'copy' keyword arguments. To learn more, see the migration guide https://numpy.org/devdocs/numpy_2_0_migration_guide.html#adapting-to-changes-in-the-copy-keyword
  windgridx, windgridy, uwind = interpolate_to_grid(x_masked, y_masked, np.array(u),
/home/runner/work/MetPy/MetPy/examples/gridding/Wind_SLP_Interpolation.py:73: DeprecationWarning: __array__ implementation doesn't accept a copy keyword, so passing copy=False failed. __array__ must implement 'dtype' and 'copy' keyword arguments. To learn more, see the migration guide https://numpy.org/devdocs/numpy_2_0_migration_guide.html#adapting-to-changes-in-the-copy-keyword
  _, _, vwind = interpolate_to_grid(x_masked, y_masked, np.array(v), interp_type='cressman',
Get temperature information
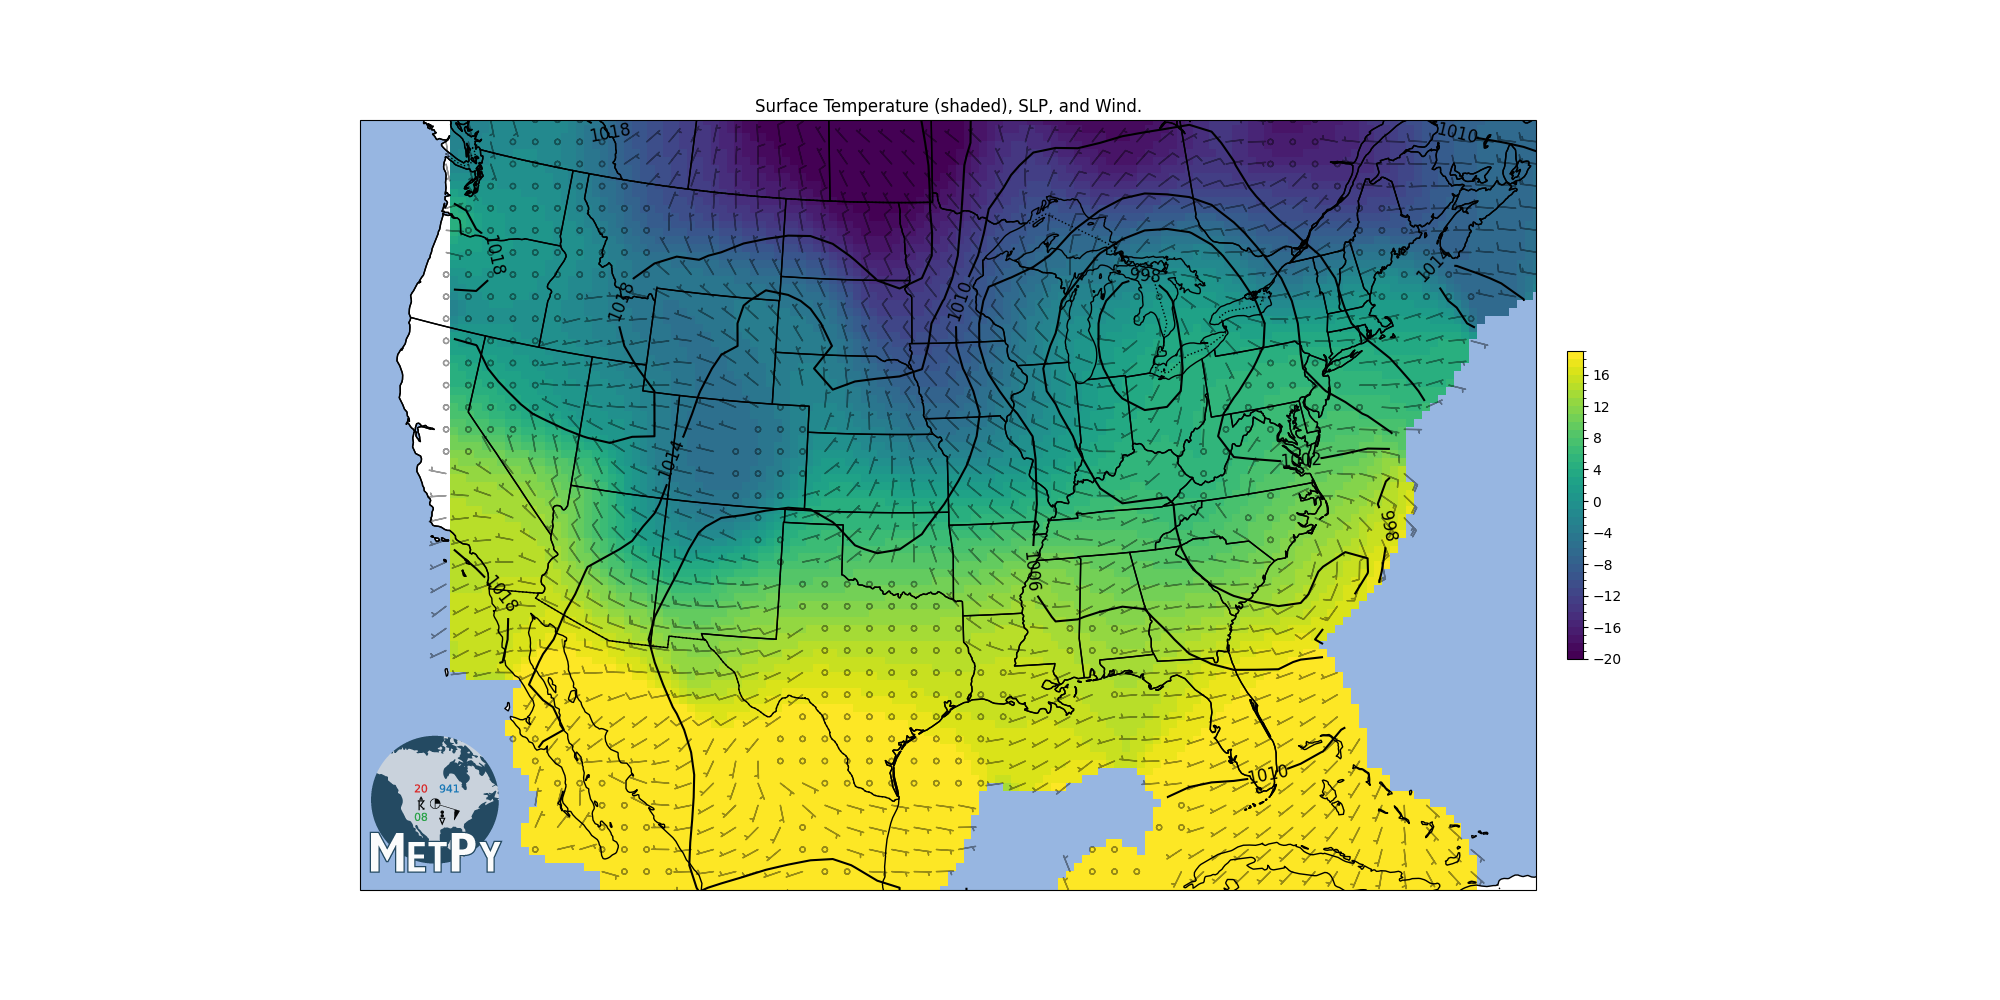
Set up the map and plot the interpolated grids appropriately.
levels = list(range(-20, 20, 1))
cmap = plt.get_cmap('viridis')
norm = BoundaryNorm(levels, ncolors=cmap.N, clip=True)

fig = plt.figure(figsize=(20, 10))
add_metpy_logo(fig, 360, 120, size='large')
view = fig.add_subplot(1, 1, 1, projection=to_proj)

view.set_extent([-120, -70, 20, 50])
view.add_feature(cfeature.STATES.with_scale('50m'))
view.add_feature(cfeature.OCEAN)
view.add_feature(cfeature.COASTLINE.with_scale('50m'))
view.add_feature(cfeature.BORDERS, linestyle=':')

cs = view.contour(slpgridx, slpgridy, slp, colors='k', levels=list(range(990, 1034, 4)))
view.clabel(cs, inline=1, fontsize=12, fmt='%i')

mmb = view.pcolormesh(tempx, tempy, temp, cmap=cmap, norm=norm)
fig.colorbar(mmb, shrink=.4, pad=0.02, boundaries=levels)

view.barbs(windgridx, windgridy, uwind, vwind, alpha=.4, length=5)

view.set_title('Surface Temperature (shaded), SLP, and Wind.')

plt.show()
Total running time of the script: (0 minutes 9.361 seconds)