
Note
Go to the end to download the full example code.
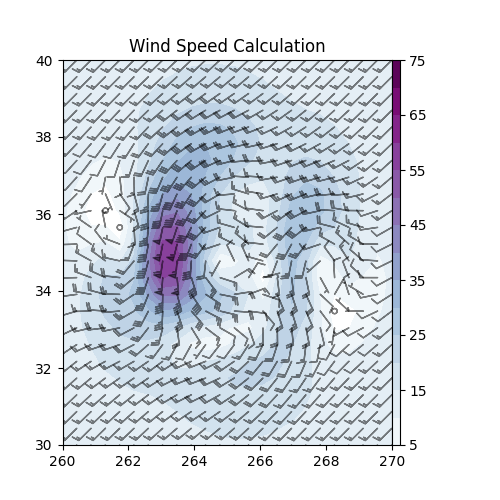
Wind Speed#
This example demonstrates the calculation of wind speed using the example xarray Dataset and plotting using Matplotlib.
import matplotlib.pyplot as plt

import metpy.calc as mpcalc
from metpy.cbook import example_data

# load example data
ds = example_data()

# Calculate the total deformation of the flow
wind_speed = mpcalc.wind_speed(ds.uwind, ds.vwind)

# start figure and set axis
fig, ax = plt.subplots(figsize=(5, 5))

# plot wind speed
cf = ax.contourf(ds.lon, ds.lat, wind_speed, range(5, 80, 5), cmap=plt.cm.BuPu)
plt.colorbar(cf, pad=0, aspect=50)
ax.barbs(ds.lon.values, ds.lat.values, ds.uwind, ds.vwind, color='black', length=5, alpha=0.5)
ax.set(xlim=(260, 270), ylim=(30, 40))
ax.set_title('Wind Speed Calculation')

plt.show()
Total running time of the script: (0 minutes 0.113 seconds)