
Note
Go to the end to download the full example code.
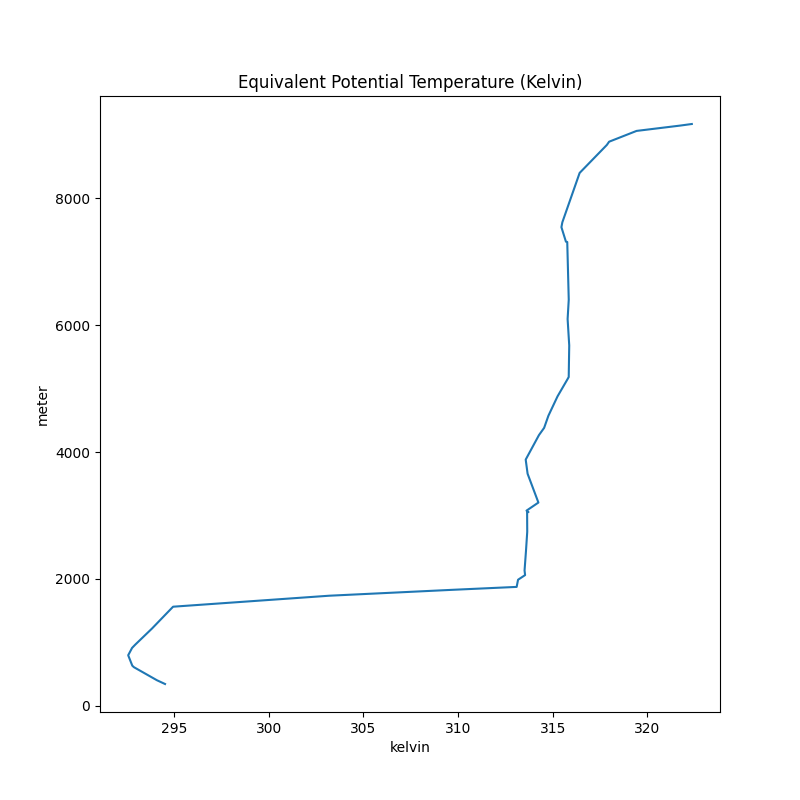
Equivalent Potential Temperature#
Use functions from metpy.calc as well as pint’s unit support to perform calculations.
The code below uses example data from our test suite to calculate the equivalent potential temperature over the provided sounding data and plots the values up to 300-hPa.
import matplotlib.pyplot as plt
import pandas as pd

from metpy.calc import equivalent_potential_temperature
from metpy.cbook import get_test_data
from metpy.units import units
Upper air data can be obtained using the siphon package, but for this example we will use some of MetPy’s sample data.
# Set column names
col_names = ['pressure', 'height', 'temperature', 'dewpoint', 'direction', 'speed']

# Read in test data using col_names
df = pd.read_fwf(get_test_data('jan20_sounding.txt', as_file_obj=False),
                 skiprows=5, usecols=[0, 1, 2, 3, 6, 7], names=col_names)
Drop any rows with all NaN values for T, Td, winds
Isolate pressure, temperature, dewpoint, and height and add units
p = df['pressure'].values * units.hPa
T = df['temperature'].values * units.degC
Td = df['dewpoint'].values * units.degC
h = df['height'].values * units.meter
Calculate the equivalent potential temperature for the whole sounding
Define a layer with pressure greater than 300 hPa
Use the layer defined above and plot the equivalent potential temperature
Total running time of the script: (0 minutes 0.074 seconds)