
Note
Go to the end to download the full example code.
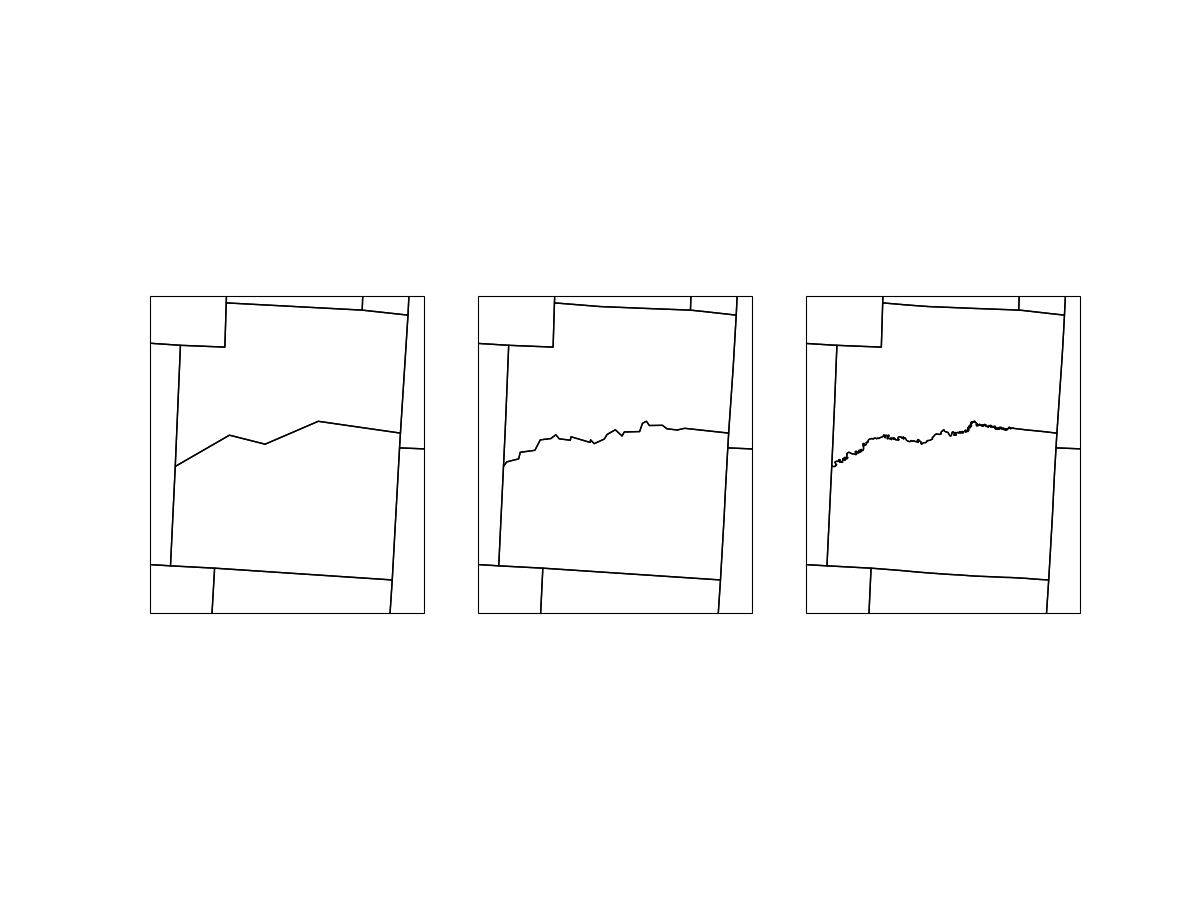
US Counties#
Demonstrate how to plot US counties at all three available resolutions.
import cartopy.crs as ccrs
import matplotlib.pyplot as plt

from metpy.plots import USCOUNTIES
proj = ccrs.LambertConformal(central_longitude=-85.0, central_latitude=45.0)

fig = plt.figure(figsize=(12, 9))
ax1 = fig.add_subplot(1, 3, 1, projection=proj)
ax2 = fig.add_subplot(1, 3, 2, projection=proj)
ax3 = fig.add_subplot(1, 3, 3, projection=proj)

for scale, axis in zip(['20m', '5m', '500k'], [ax1, ax2, ax3], strict=False):
    axis.set_extent([270.25, 270.9, 38.15, 38.75], ccrs.Geodetic())
    axis.add_feature(USCOUNTIES.with_scale(scale))
Total running time of the script: (0 minutes 2.123 seconds)