StationPlot#
- class metpy.plots.StationPlot(ax, x, y, fontsize=10, spacing=None, transform=None, **kwargs)[source]#
Make a standard meteorological station plot.
Plots values, symbols, or text spaced around a central location. Can also plot wind barbs as the center of the location.
Initialize the StationPlot with items that do not change.
This sets up the axes and station locations. The fontsize and spacing are also specified here to ensure that they are consistent between individual station elements.
- Parameters:
ax (matplotlib.axes.Axes) – The
Axesfor plottingx (array-like) – The x location of the stations in the plot
y (array-like) – The y location of the stations in the plot
fontsize (int) – The fontsize to use for drawing text
spacing (int) – The spacing, in points, that corresponds to a single increment between station plot elements.
transform (matplotlib.transforms.Transform) – The default transform to apply to the x and y positions when plotting. Works with anything compatible with the
Transforminterface.kwargs – Additional keyword arguments to use for matplotlib’s plotting functions. These will be passed to all the plotting methods, and thus need to be valid for all plot types, such as clip_on.
Attributes Summary
Methods Summary
__init__(ax, x, y[, fontsize, spacing, ...])Initialize the StationPlot with items that do not change.
plot_arrow(u, v, **kwargs)At the center of the station model plot wind arrows.
plot_barb(u, v, **kwargs)At the center of the station model plot wind barbs.
plot_parameter(location, parameter[, formatter])At the specified location in the station model plot a set of values.
plot_symbol(location, codes, symbol_mapper, ...)At the specified location in the station model plot a set of symbols.
plot_text(location, text, **kwargs)At the specified location in the station model plot a collection of text.
Attributes Documentation
- location_names = {'C': (0, 0), 'E': (1, 0), 'E2': (2, 0), 'ENE': (2, 1), 'ESE': (2, -1), 'N': (0, 1), 'N2': (0, 2), 'NE': (1, 1), 'NNE': (1, 2), 'NNW': (-1, 2), 'NW': (-1, 1), 'S': (0, -1), 'S2': (0, -2), 'SE': (1, -1), 'SSE': (1, -2), 'SSW': (-1, -2), 'SW': (-1, -1), 'W': (-1, 0), 'W2': (-2, 0), 'WNW': (-2, 1), 'WSW': (-2, -1)}#
Methods Documentation
- __init__(ax, x, y, fontsize=10, spacing=None, transform=None, **kwargs)[source]#
Initialize the StationPlot with items that do not change.
This sets up the axes and station locations. The fontsize and spacing are also specified here to ensure that they are consistent between individual station elements.
- Parameters:
ax (matplotlib.axes.Axes) – The
Axesfor plottingx (array-like) – The x location of the stations in the plot
y (array-like) – The y location of the stations in the plot
fontsize (int) – The fontsize to use for drawing text
spacing (int) – The spacing, in points, that corresponds to a single increment between station plot elements.
transform (matplotlib.transforms.Transform) – The default transform to apply to the x and y positions when plotting. Works with anything compatible with the
Transforminterface.kwargs – Additional keyword arguments to use for matplotlib’s plotting functions. These will be passed to all the plotting methods, and thus need to be valid for all plot types, such as clip_on.
- plot_arrow(u, v, **kwargs)[source]#
At the center of the station model plot wind arrows.
Additional keyword arguments given will be passed onto matplotlib’s
quiver()function; this is useful for specifying things like color or line width.- Parameters:
u (array-like) – The data to use for the u-component of the arrows.
v (array-like) – The data to use for the v-component of the arrows.
plot_units (pint.unit) – Units to plot in (performing conversion if necessary). Defaults to given units.
kwargs – Additional keyword arguments to pass to matplotlib’s
barbs()function.
See also
- plot_barb(u, v, **kwargs)[source]#
At the center of the station model plot wind barbs.
Additional keyword arguments given will be passed onto matplotlib’s
barbs()function; this is useful for specifying things like color or line width.- Parameters:
u (array-like) – The data to use for the u-component of the barbs.
v (array-like) – The data to use for the v-component of the barbs.
plot_units (
pint.Unit) – Units to plot in (performing conversion if necessary). Defaults to given units.kwargs – Additional keyword arguments to pass to matplotlib’s
barbs()function.
See also
- plot_parameter(location, parameter, formatter=None, **kwargs)[source]#
At the specified location in the station model plot a set of values.
This specifies that at the offset location, the data in parameter should be plotted. The conversion of the data values to a string is controlled by
formatter.Additional keyword arguments given will be passed onto the actual plotting code; this is useful for specifying things like color or font properties.
If something has already been plotted at this location, it will be replaced.
- Parameters:
location (str or tuple[float, float]) – The offset (relative to center) to plot this parameter. If str, should be one of ‘C’, ‘N’, ‘NE’, ‘E’, ‘SE’, ‘S’, ‘SW’, ‘W’, or ‘NW’. Otherwise, should be a tuple specifying the number of increments in the x and y directions; increments are multiplied by spacing to give offsets in x and y relative to the center.
parameter (array-like) – The numeric values that should be plotted
formatter (str or Callable, optional) – How to format the data as a string for plotting. If a string, it should be compatible with the
format()builtin. If a callable, this should take a value and return a string. Defaults to ‘z0.f’.plot_units (pint.unit) – Units to plot in (performing conversion if necessary). Defaults to given units.
kwargs – Additional keyword arguments to use for matplotlib’s plotting functions.
See also
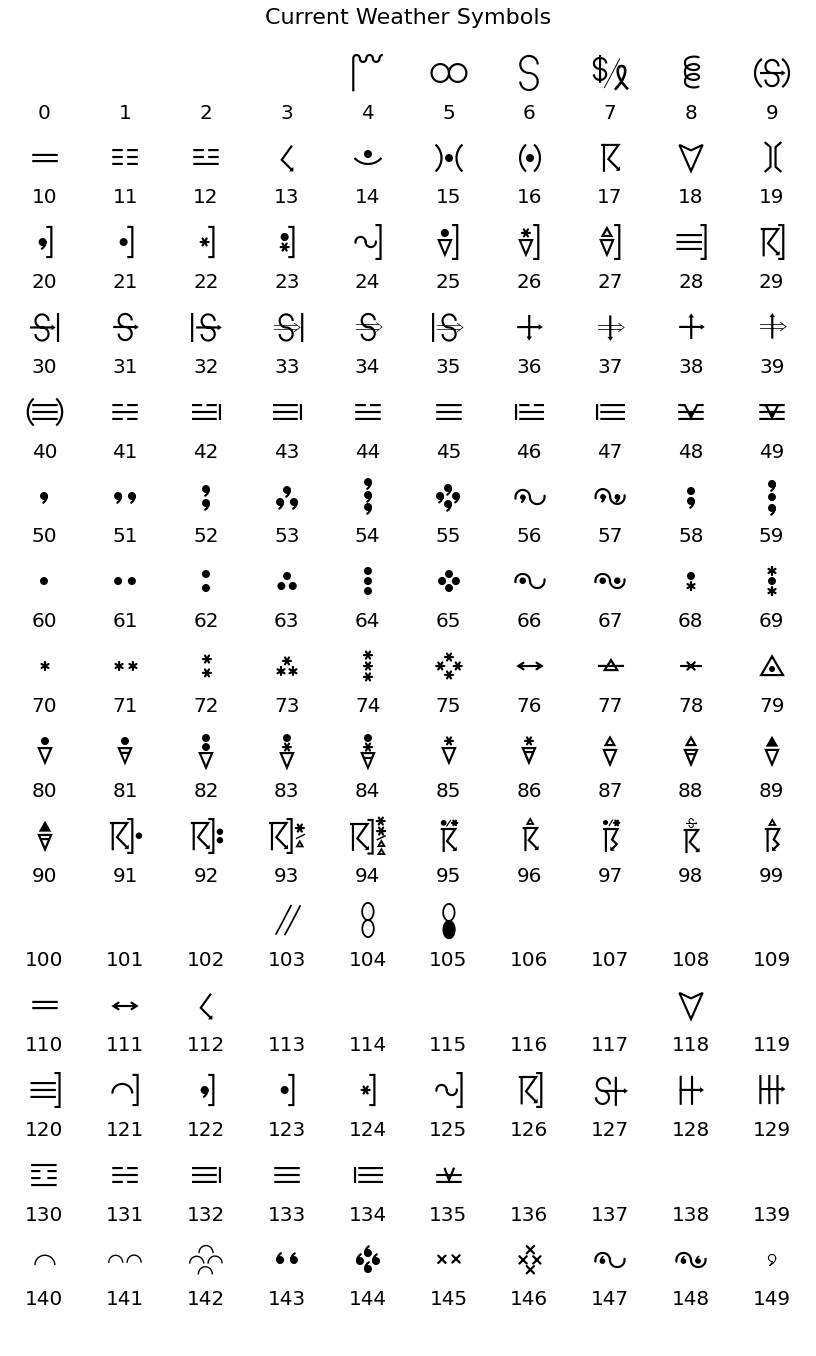
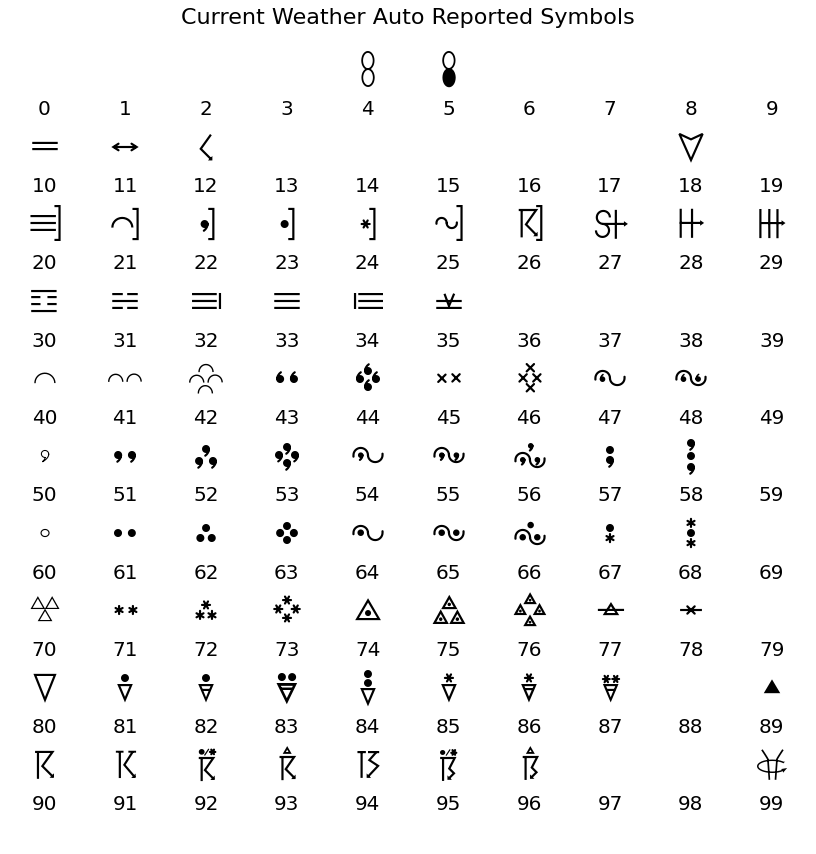
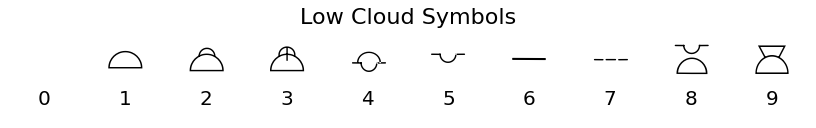
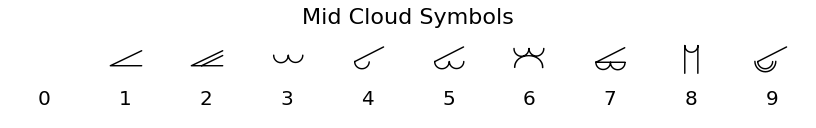
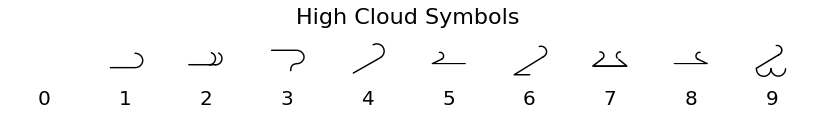
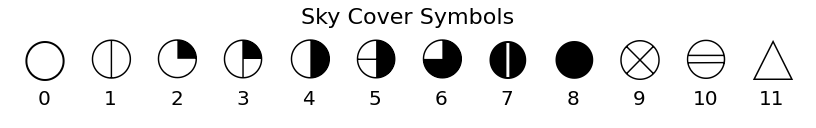
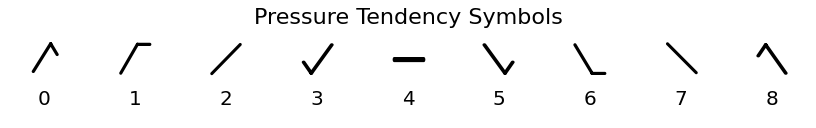
- plot_symbol(location, codes, symbol_mapper, **kwargs)[source]#
At the specified location in the station model plot a set of symbols.
This specifies that at the offset location, the data in codes should be converted to unicode characters (for our
metpy.plots.wx_symbols.wx_symbol_font) using symbol_mapper, and plotted.Additional keyword arguments given will be passed onto the actual plotting code; this is useful for specifying things like color or font properties.
If something has already been plotted at this location, it will be replaced.
- Parameters:
location (str or tuple[float, float]) – The offset (relative to center) to plot this parameter. If str, should be one of ‘C’, ‘N’, ‘NE’, ‘E’, ‘SE’, ‘S’, ‘SW’, ‘W’, or ‘NW’. Otherwise, should be a tuple specifying the number of increments in the x and y directions; increments are multiplied by spacing to give offsets in x and y relative to the center.
codes (array-like) – The numeric values that should be converted to unicode characters for plotting.
symbol_mapper (Callable) – Controls converting data values to unicode code points for the
metpy.plots.wx_symbols.wx_symbol_fontfont. This should take a value and return a single unicode character. Seemetpy.plots.wx_symbolsfor included mappers.kwargs – Additional keyword arguments to use for matplotlib’s plotting functions.
See also
- plot_text(location, text, **kwargs)[source]#
At the specified location in the station model plot a collection of text.
This specifies that at the offset
location, the strings intextshould be plotted.Additional keyword arguments given will be passed onto the actual plotting code; this is useful for specifying things like color or font properties.
If something has already been plotted at this location, it will be replaced.
- Parameters:
location (str or tuple[float, float]) – The offset (relative to center) to plot this parameter. If str, should be one of ‘C’, ‘N’, ‘NE’, ‘E’, ‘SE’, ‘S’, ‘SW’, ‘W’, or ‘NW’. Otherwise, should be a tuple specifying the number of increments in the x and y directions; increments are multiplied by spacing to give offsets in x and y relative to the center.
text (Sequence[str]) – The strings that should be plotted
kwargs – Additional keyword arguments to use for matplotlib’s plotting functions.
See also