cross_section#
- metpy.interpolate.cross_section(data, start, end, steps=100, interp_type='linear')[source]#
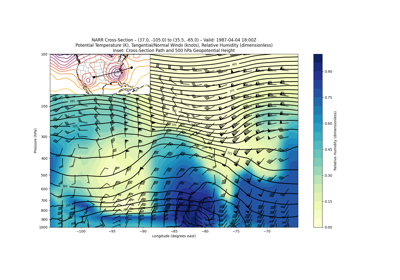
Obtain an interpolated cross-sectional slice through gridded data.
Utilizing the interpolation functionality in xarray, this function takes a vertical cross-sectional slice along a geodesic through the given data on a regular grid, which is given as an
xarray.DataArrayso that we can utilize its coordinate and projection metadata.- Parameters:
data (
xarray.DataArrayorxarray.Dataset) – Three- (or higher) dimensional field(s) to interpolate. The DataArray (or each DataArray in the Dataset) must have been parsed by MetPy and include both an x and y coordinate dimension and the added crs coordinate.start ((2, ) array-like) – A latitude-longitude pair designating the start point of the cross section (units are degrees north and degrees east).
end ((2, ) array-like) – A latitude-longitude pair designating the end point of the cross section (units are degrees north and degrees east).
steps (int, optional) – The number of points along the geodesic between the start and the end point (including the end points) to use in the cross section. Defaults to 100.
interp_type (str, optional) – The interpolation method, either ‘linear’ or ‘nearest’ (see xarray.DataArray.interp() for details). Defaults to ‘linear’.
- Returns:
xarray.DataArrayorxarray.Dataset– The interpolated cross section, with new index dimension along the cross-section.
See also