Ocean reanalyses in 2010 (Deepwater Horizon year)
[1]:
bathy_URL = 'http://geoport.whoi.edu/thredds/dodsC/bathy/etopo1_bed_g2'
glb90_URL = 'http://tds.hycom.org/thredds/dodsC/GLBa0.08/expt_90.8'
glb19_URL = 'http://tds.hycom.org/thredds/dodsC/GLBu0.08/expt_19.1/2010'
gom31_URL = 'http://tds.hycom.org/thredds/dodsC/GOMl0.04/expt_31.0/2010'
gom50_URL = 'http://tds.hycom.org/thredds/dodsC/GOMu0.04/expt_50.1/data/netcdf/2010'
glb53_URL = 'http://tds.hycom.org/thredds/dodsC/GLBv0.08/expt_53.X/data/2010'
[3]:
import xarray as xr
%pylab inline
Populating the interactive namespace from numpy and matplotlib
[4]:
# test opendap connection
xr.open_dataset(bathy_URL)
[4]:
<xarray.Dataset>
Dimensions:  (lat: 10801, lon: 21601)
Coordinates:
  * lon      (lon) float64 -180.0 -180.0 -180.0 -179.9 ... 180.0 180.0 180.0
  * lat      (lat) float32 -90.0 -89.98333 -89.96667 ... 89.96667 89.98333 90.0
Data variables:
    topo     (lat, lon) float32 ...
Attributes:
    Conventions:  COARDS/CF-1.0
    title:        NGDC ETOPO1 Global DEM (1 min)
    history:      grdreformat ETOPO1_Bed_g.int.grd=ni ETOPO1_Bed_g.grd=ns
    GMT_version:  4.3.1b
    node_offset:  0
[5]:
glb90 = xr.open_dataset(glb90_URL, decode_times=False)
[6]:
glb90
[6]:
<xarray.Dataset>
Dimensions:                    (Depth: 33, MT: 606, X: 4500, Y: 3298)
Coordinates:
  * Y                          (Y) int32 1 2 3 4 5 ... 3294 3295 3296 3297 3298
  * X                          (X) int32 1 2 3 4 5 ... 4496 4497 4498 4499 4500
  * Depth                      (Depth) float32 0.0 10.0 20.0 ... 5000.0 5500.0
  * MT                         (MT) float64 3.957e+04 3.958e+04 ... 4.018e+04
    Date                       (MT) float64 ...
    Latitude                   (Y, X) float32 ...
    Longitude                  (Y, X) float32 ...
Data variables:
    mld                        (MT, Y, X) float32 ...
    mlp                        (MT, Y, X) float32 ...
    qtot                       (MT, Y, X) float32 ...
    emp                        (MT, Y, X) float32 ...
    surface_temperature_trend  (MT, Y, X) float32 ...
    surface_salinity_trend     (MT, Y, X) float32 ...
    ssh                        (MT, Y, X) float32 ...
    salinity                   (MT, Depth, Y, X) float32 ...
    temperature                (MT, Depth, Y, X) float32 ...
    u                          (MT, Depth, Y, X) float32 ...
    v                          (MT, Depth, Y, X) float32 ...
Attributes:
    Conventions:  CF-1.0
    title:        HYCOM GLBa0.08
    institution:  Naval Research Laboratory
    source:       HYCOM archive file
    experiment:   90.8
    history:      archv2ncdf2d
[7]:
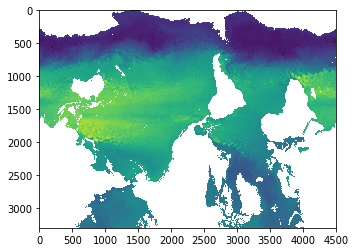
ssh = glb90.ssh
imshow(ssh[0,:,:])
[7]:
<matplotlib.image.AxesImage at 0x318326dd8>

[8]:
gom50 = xr.open_dataset(gom50_URL, decode_times=False)
[9]:
gom50
[9]:
<xarray.Dataset>
Dimensions:     (depth: 40, lat: 346, lon: 541, time: 2920)
Coordinates:
  * depth       (depth) float64 0.0 2.0 4.0 6.0 ... 2.5e+03 3e+03 4e+03 5e+03
  * lat         (lat) float64 18.12 18.16 18.2 18.24 ... 31.8 31.84 31.88 31.92
  * lon         (lon) float64 -98.0 -97.96 -97.92 -97.88 ... -76.48 -76.44 -76.4
  * time        (time) float64 8.767e+04 8.768e+04 ... 9.643e+04 9.643e+04
Data variables:
    tau         (time) float64 ...
    water_u     (time, depth, lat, lon) float32 ...
    water_v     (time, depth, lat, lon) float32 ...
    water_temp  (time, depth, lat, lon) float32 ...
    salinity    (time, depth, lat, lon) float32 ...
    surf_el     (time, lat, lon) float32 ...
Attributes:
    classification_level:      UNCLASSIFIED
    distribution_statement:    Approved for public release. Distribution unli...
    downgrade_date:            not applicable
    classification_authority:  not applicable
    institution:               Naval Oceanographic Office
    source:                    HYCOM archive file
    history:                   archv2ncdf3z
    field_type:                instantaneous
    Conventions:               CF-1.6 NAVO_netcdf_v1.1
[10]:
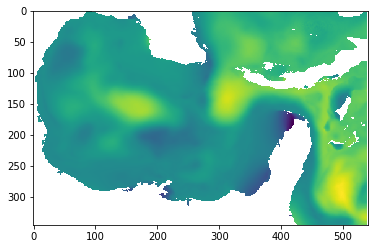
ssh50 = gom50.surf_el
imshow(ssh50[0,:,:])
[10]:
<matplotlib.image.AxesImage at 0x32accf0f0>

[ ]:
