GOES CIRA Product Writer
Notebook Python-AWIPS Tutorial Notebook
Objectives
Use python-awips to connect to an EDEX server
Define and filter the data request specifically for new CIRA GOES16 data products
Resize the products to their native resolution
Write the individual bands (channels) locally
Combine and write the RGB product locally
Table of Contents
1 Imports
The imports below are used throughout the notebook. Note the first import is coming directly from python-awips and allows us to connect to an EDEX server. The subsequent imports are for data manipulation and visualization.
from awips.dataaccess import DataAccessLayer
import cartopy.crs as ccrs
import cartopy.feature as cfeat
import matplotlib.pyplot as plt
from datetime import datetime
import numpy as np
import os
2 Initial Setup
2.1 EDEX Connection
First we establish a connection to Unidata’s public EDEX server. With that connection made, we can create a new data request object and set the data type to satellite.
# Create an EDEX data request
DataAccessLayer.changeEDEXHost("edex-cloud.unidata.ucar.edu")
request = DataAccessLayer.newDataRequest()
request.setDatatype("satellite")
2.2 Parameter Definition
After establishing the python-awips specific objects, we create a few other parameters that will be used for the data query based off of known values: projection, and extent.
# Create a projection for ECONUS and WCONUS
# Set up the projection using known parameters (from the netcdf of GOES products)
globe = ccrs.Globe(semimajor_axis=6378137.0, semiminor_axis=6356752.5, ellipse=None)
sat_h = 35785830.0
proj = ccrs.Geostationary(globe=globe, central_longitude=-75.0, satellite_height=sat_h, sweep_axis='x')

# Define the extents for ECONUS and WCONUS in goes native coords
# (originally taken from netcdf GOES data)
extent = (-3626751., 1382263.5, 1583666.1, 4588674.)
3 Function: set_size()
Here we’re defining a function that will allow us to pass in the dimensions of the output file we desire in pixels. Default Python methods require the size to be set in inches, which is confusing in our case, since we know what the size of GOES images are in pixels. Also, default Python functions add a padding when creating figures, and we don’t want that.
This function allows the exact final image to be specified based in pixels, with no padding or buffers.
def set_size(w,h, plt):
    """ w, h: width, height in pixels """

    # Convert from pixels to inches
    DPI = plt.figure().get_dpi()
    w = w/float(DPI)
    h = h/float(DPI)

    # Get the axes
    ax=plt.gca()

    # Remove the padding
    l = ax.figure.subplotpars.left
    r = ax.figure.subplotpars.right
    t = ax.figure.subplotpars.top
    b = ax.figure.subplotpars.bottom
    figw = float(w)/(r-l)
    figh = float(h)/(t-b)

    # Set the final size
    ax.figure.set_size_inches(figw, figh)

    # Return the DPI, this is used when in the
    # write_image() function
    return DPI
4 Function: write_img()
Next, we’re defining another function which takes the image data, file name, projection, extent, reference time, and whether or not to print out a footnote.
This method specifies the size of the output image and creates a plot object to draw all our data into. Then it draws the GOES data, coastlines, state boundaries, and lat/lon lines onto the image. Additionally, if we want, it writes out a short footnote describing what product we’re looking at. Finally, it writes out the figure to disk.
By default we’re specifying the output dimensions to be 5000x4000 pixels, because that is the native GOES image size, but feel free to modify these values if you wish to print out an image of another size (you may want to keep the w:h ratio the same though).
def write_img(data, name, proj, extent, reftime, footnote):

    # Specify the desired size, in pixels
    px_width = 5000.0
    px_height = 3000.0

    # Create the plot with proper projection, and set the figure size
    fig = plt.figure()
    DPI = set_size(px_width, px_height, plt)
    ax = plt.axes(projection=proj)

    # Draw GOES data
    ax.imshow(data, cmap='gray', transform=proj, extent=extent)

    # Add Coastlines and States
    ax.coastlines(resolution='50m', color='magenta', linewidth=1.0)
    ax.add_feature(cfeat.STATES, edgecolor='magenta', linewidth=1.0)
    ax.gridlines(color='cyan', linewidth=2.0, xlocs=np.arange(-180, 180, 10), linestyle=(0,(5,10)))

    # Create and draw the footnote if needed
    if footnote:
        footnoteStr = '   CIRA-'+name[7:-4]+'-'+str(reftime)
        plt.annotate(str(footnoteStr), (0,0), (0, 0), xycoords='axes fraction', textcoords='offset points', va='top')

    # Write out the figure
    plt.savefig(name, dpi=DPI, bbox_inches='tight', pad_inches=0)
5 Get the Data and Write it Out!
5.1 Filter the Data
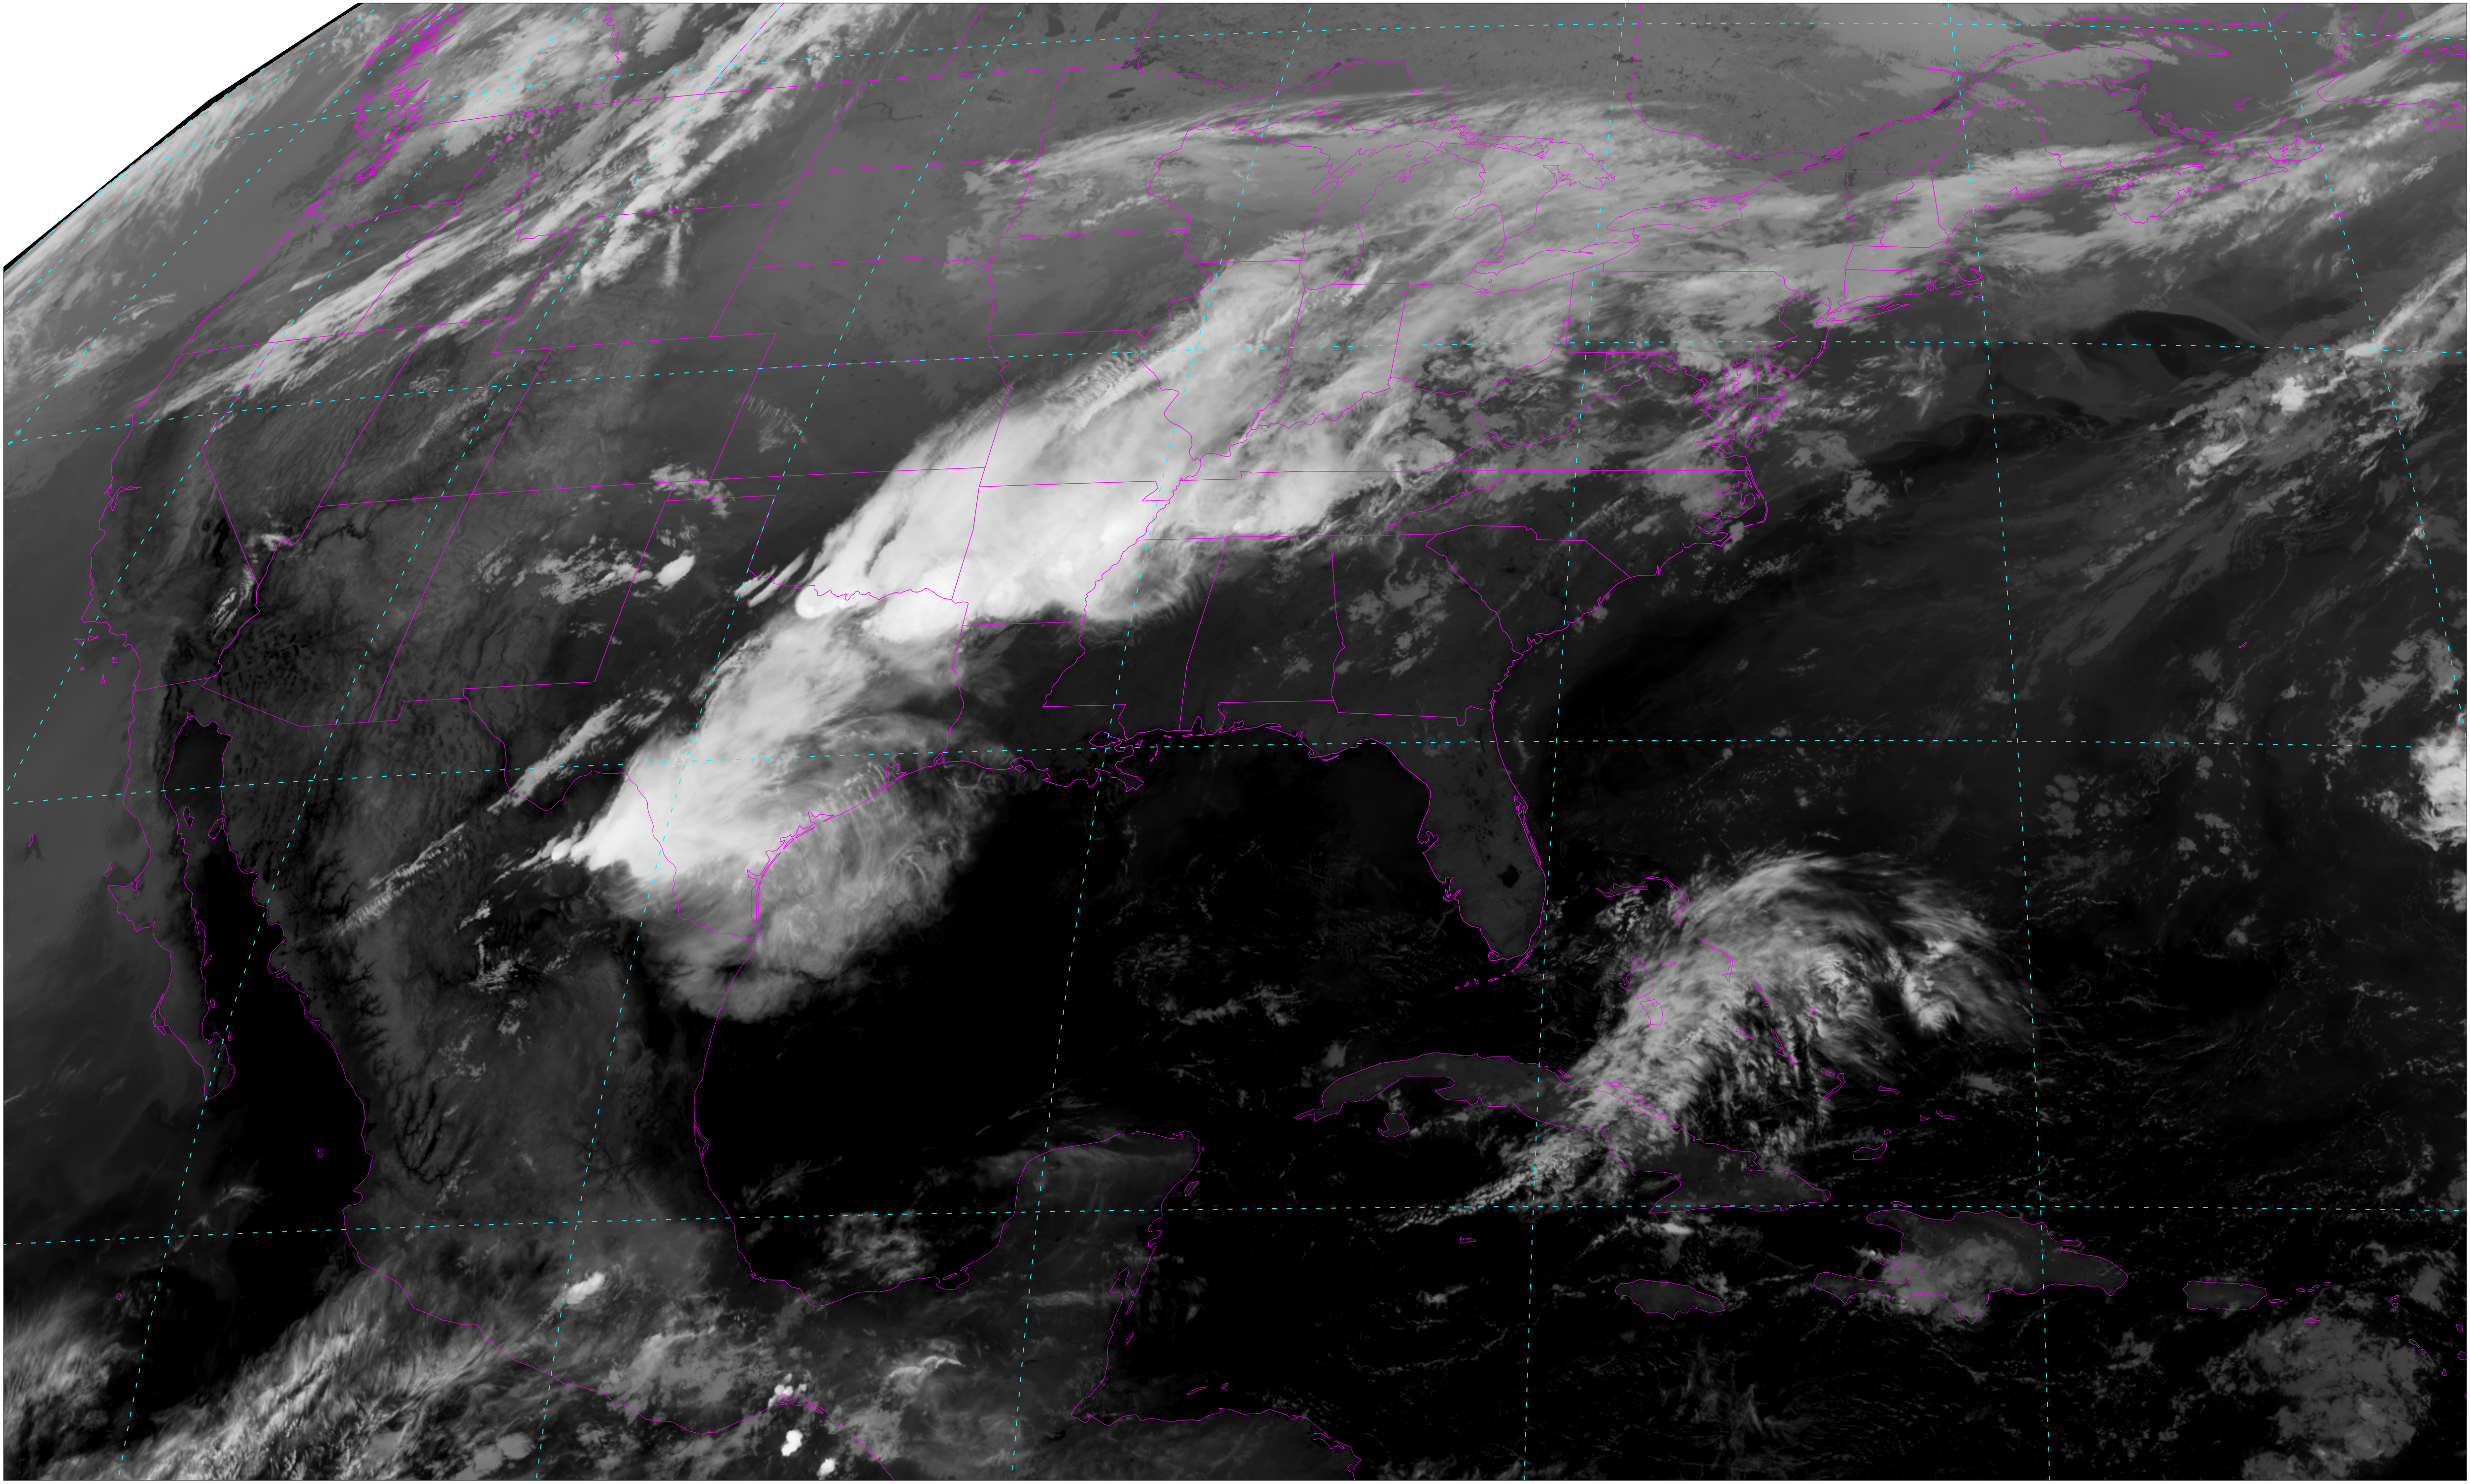
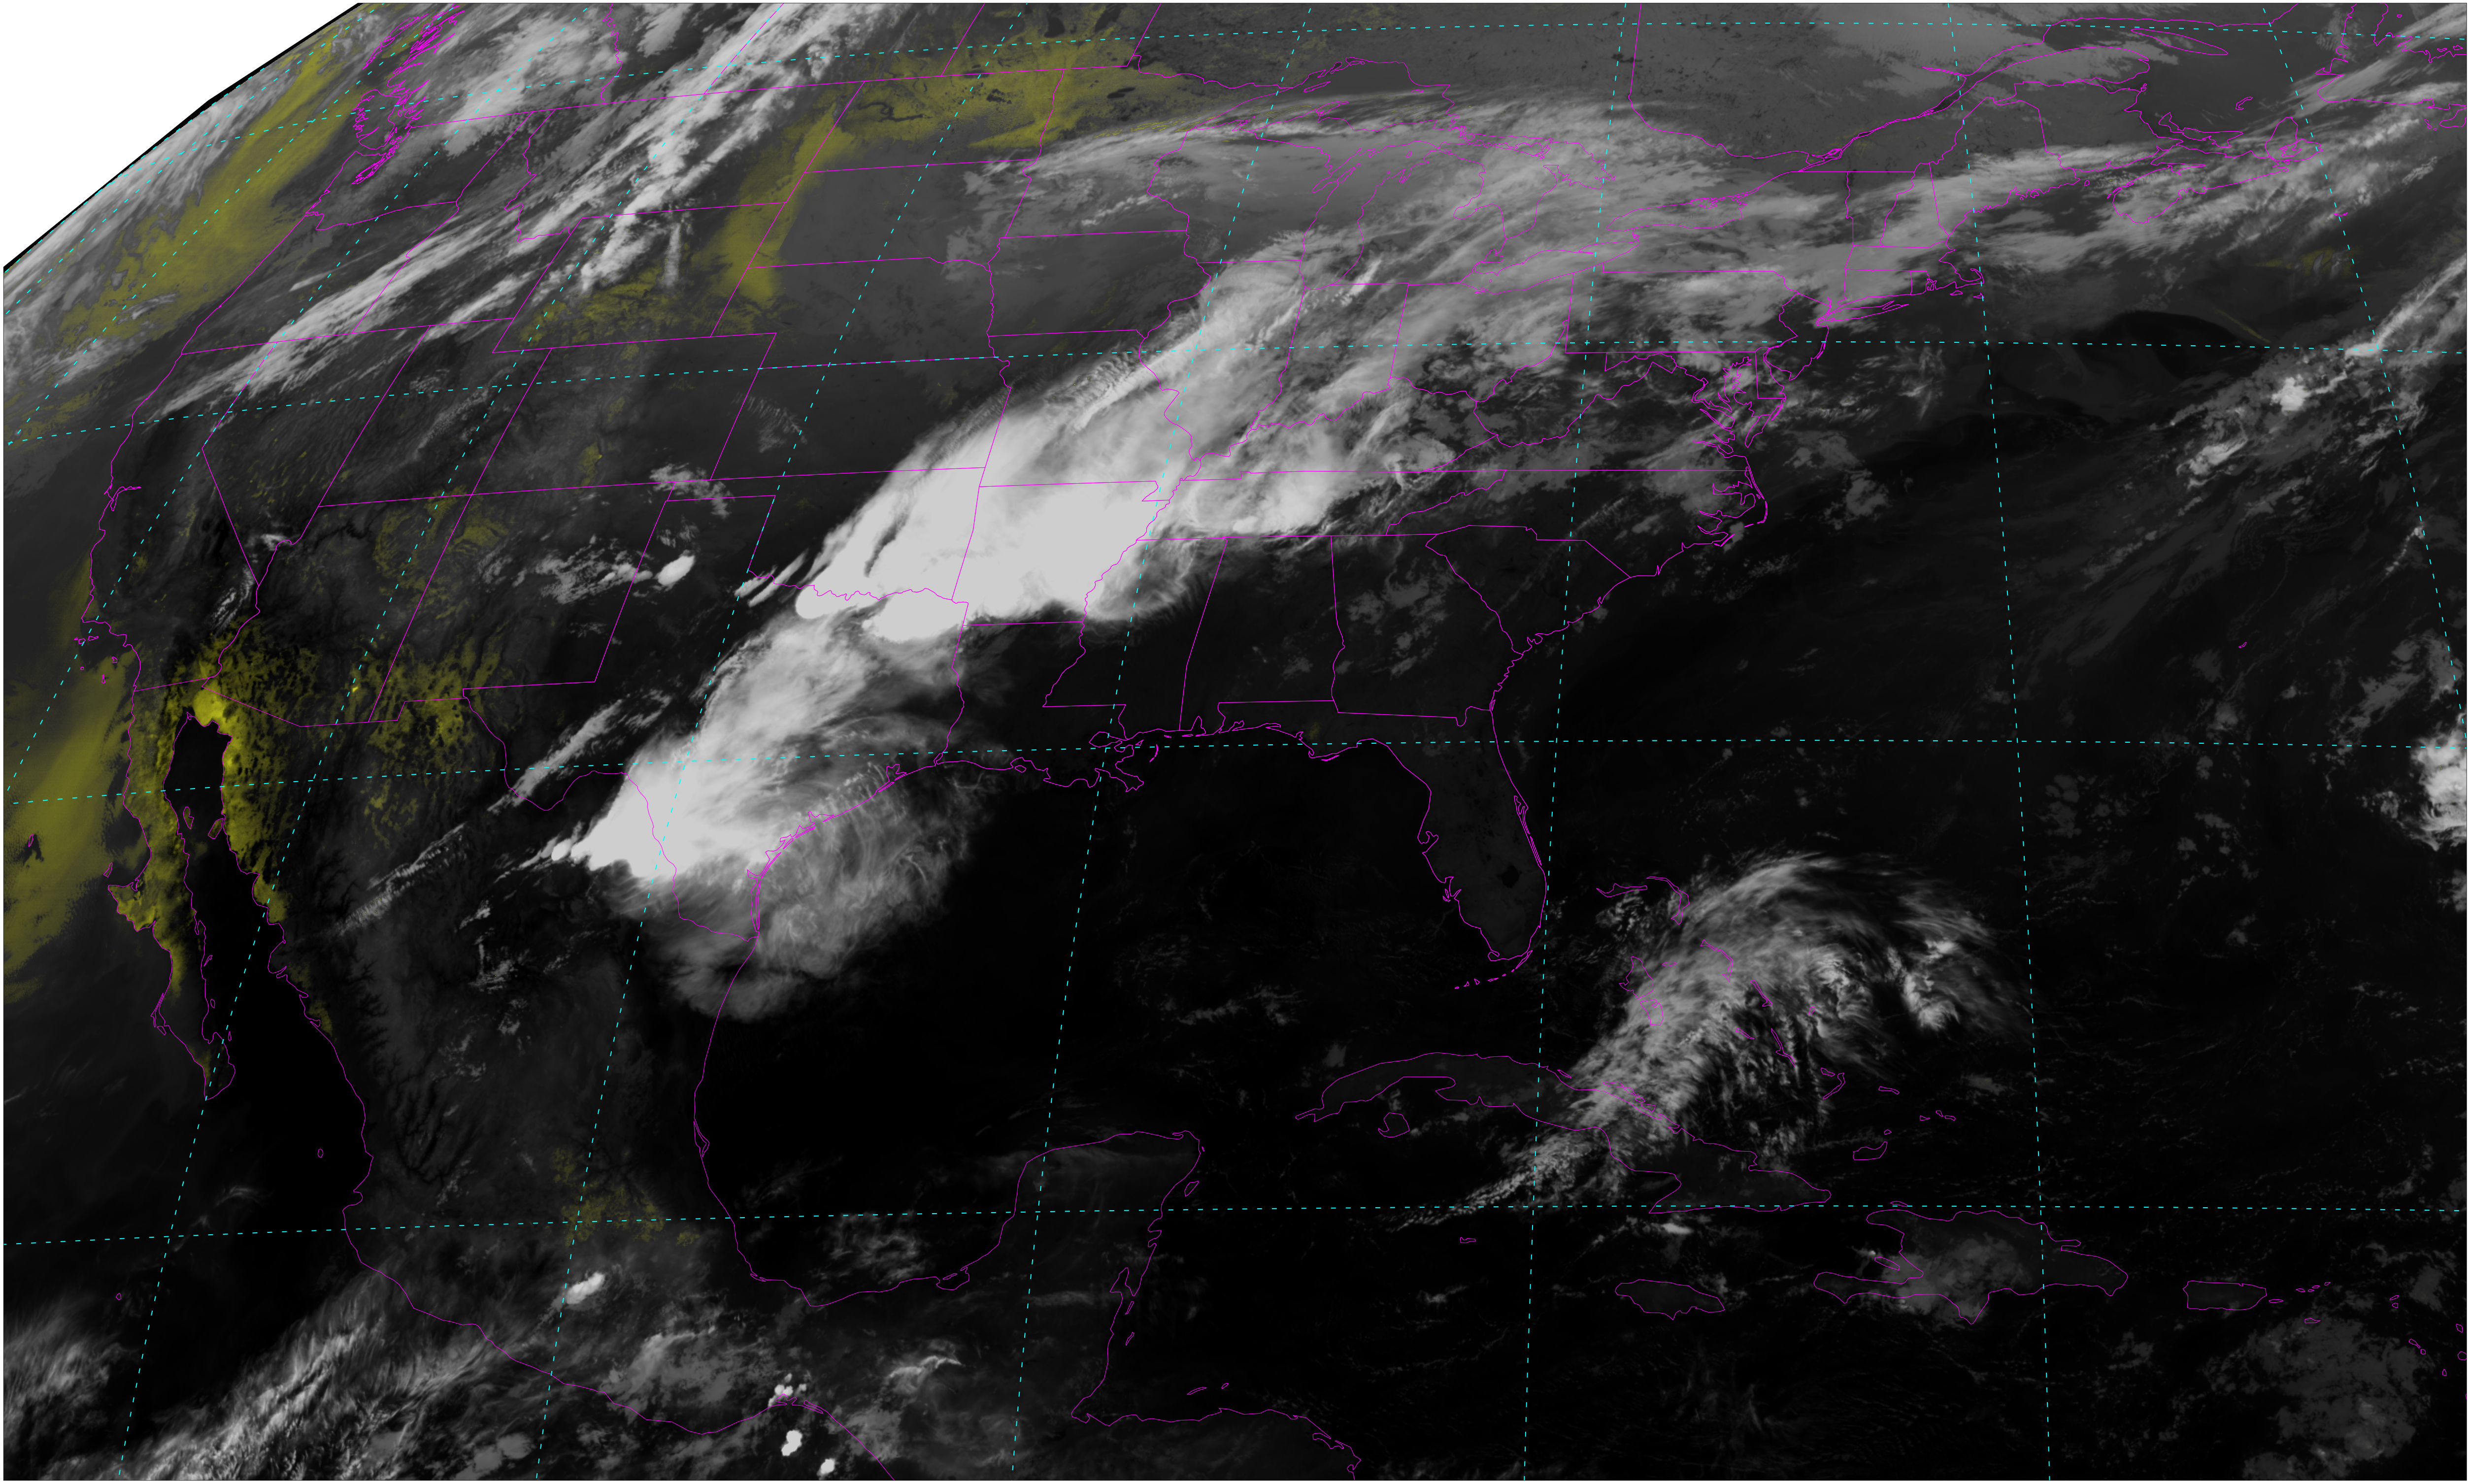
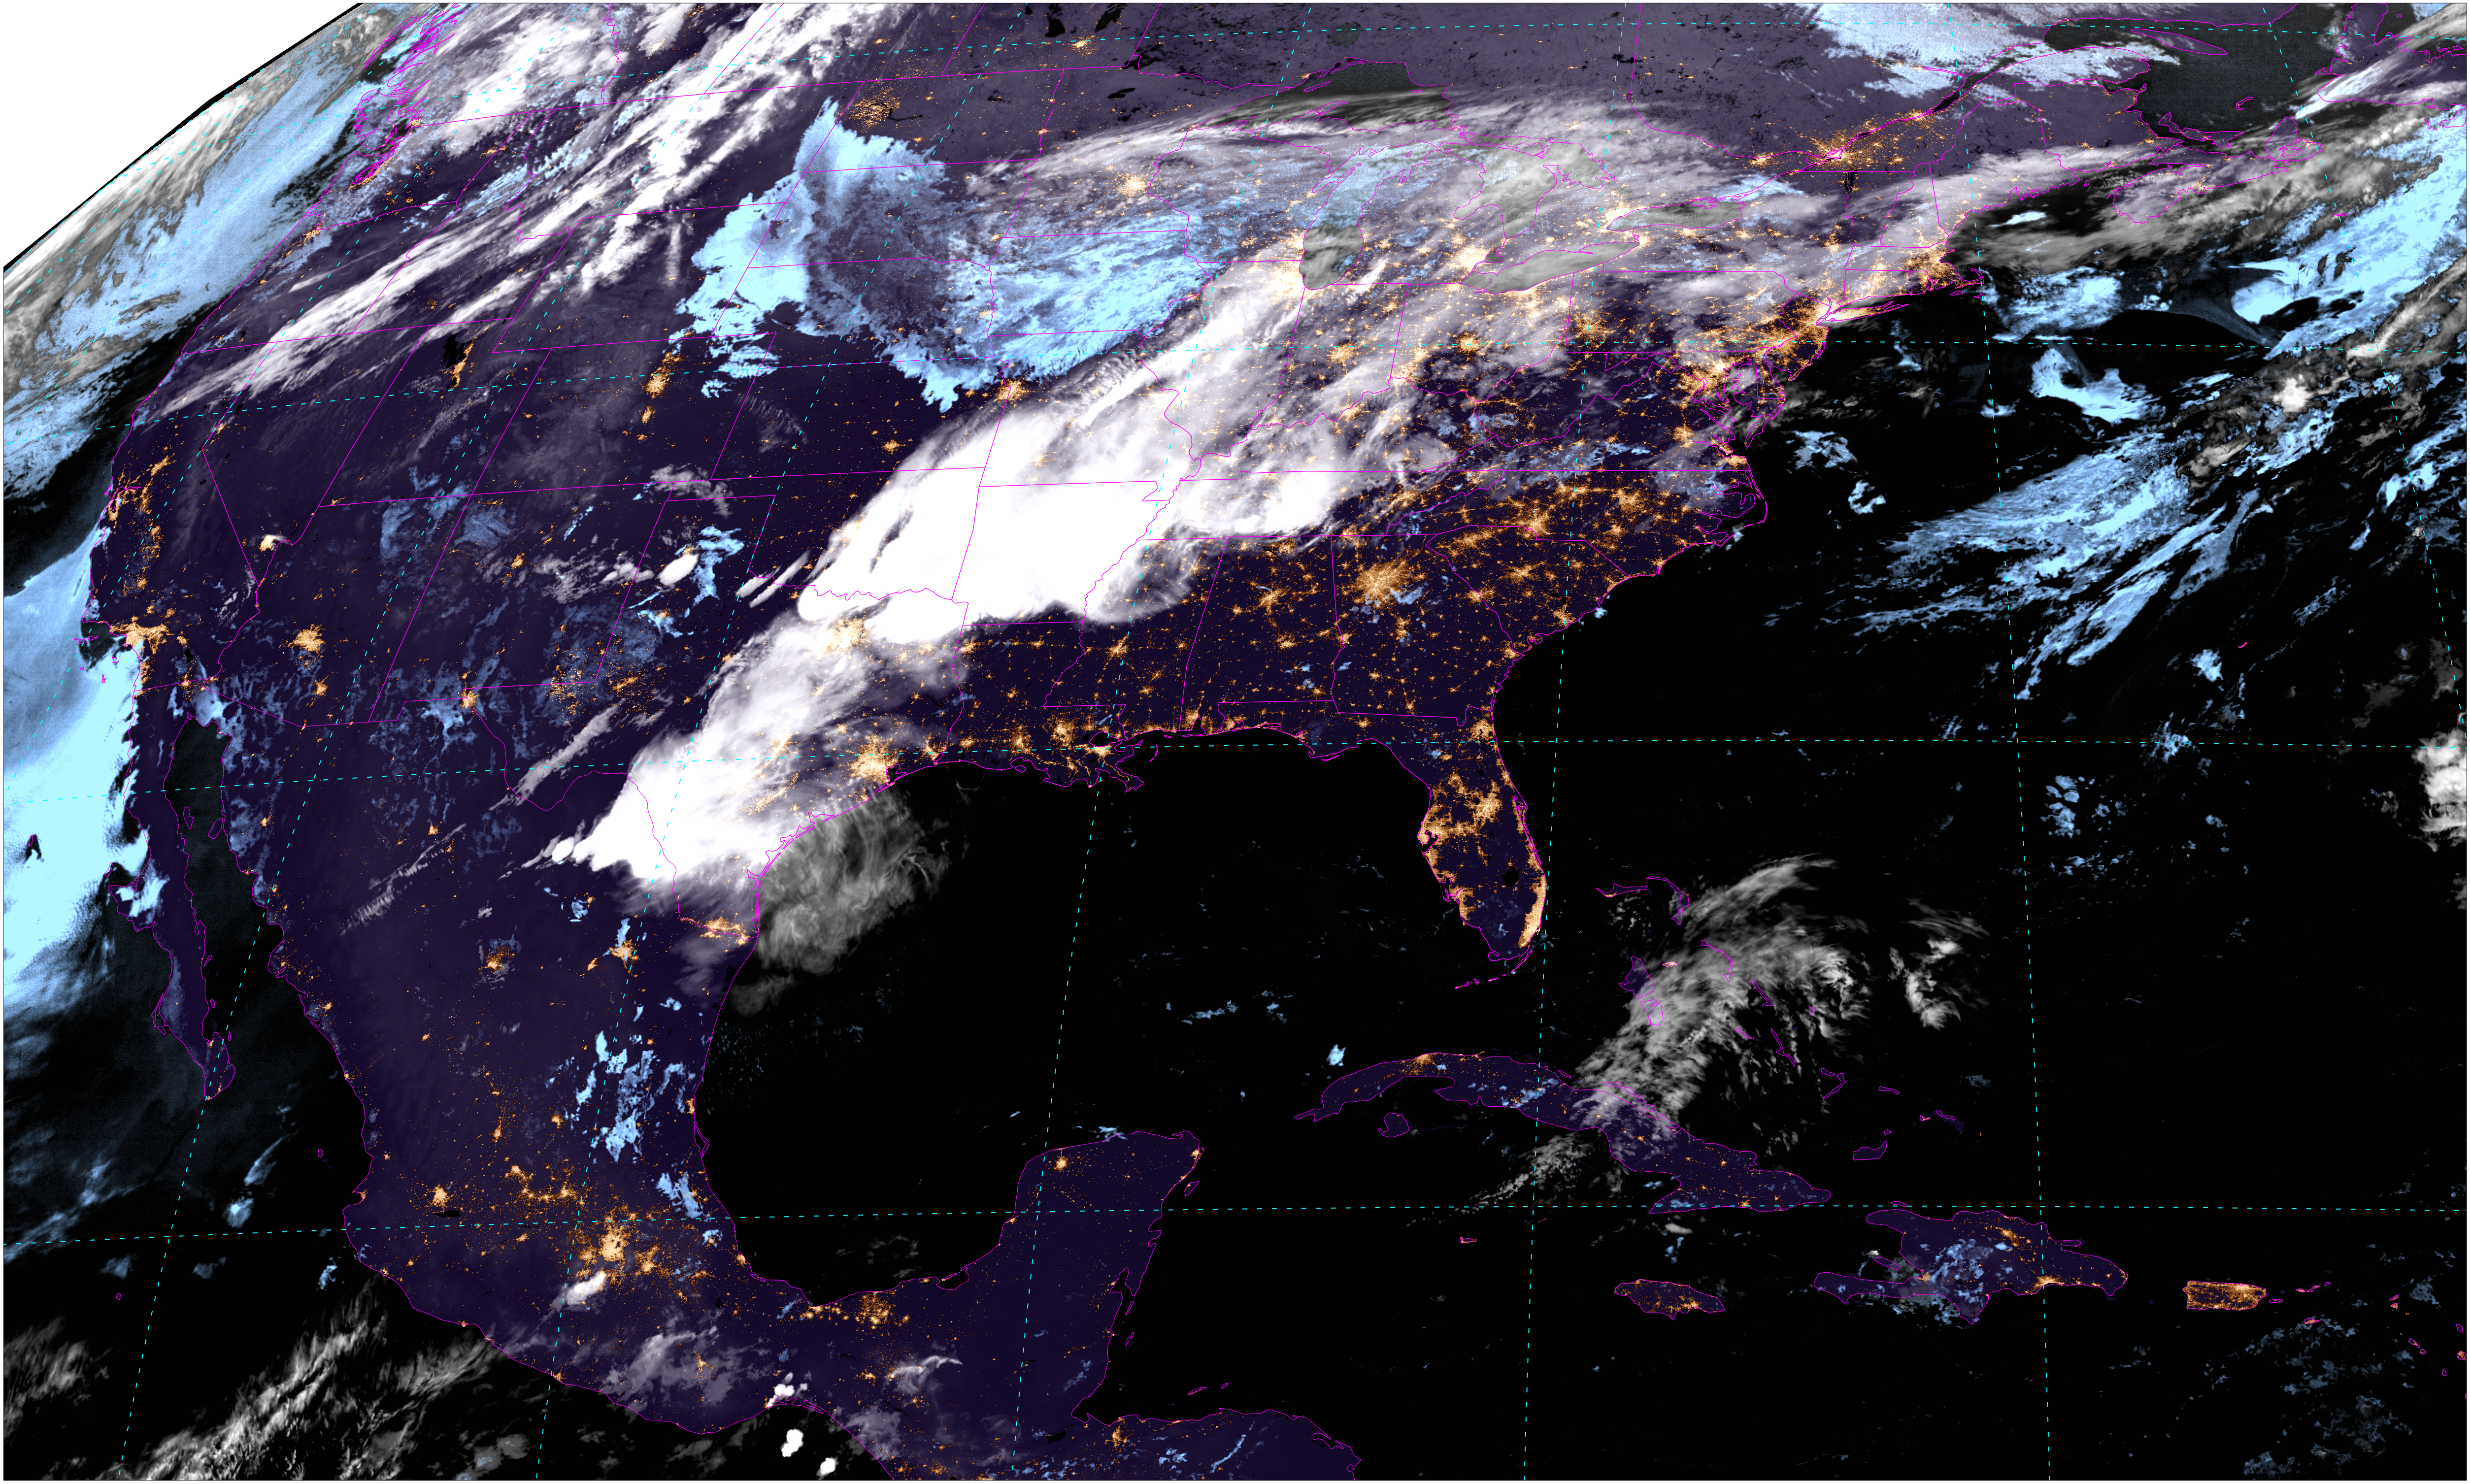
Define exactly what data we want to be printing out. This notebook is designed to loop through and print out multiple images, so here we can pick which images we’re wanting to print out. We’re specifying ECONUS (for East CONUS), CLDSNOW, DBRDUST, and GEOCOLR (for the new CIRA products) and the three channels for the RBG composites.
Tip: More information could be gathered by looking at all the available location names (sectors), identifiers (entities), and parameters (channels). To see those run the following lines of code after the dataType has been set to satellite on the request object:
## Print Available Location Names
print((DataAccessLayer.getAvailableLocationNames(request))

## Print Available Identifiers and Values
ids = DataAccessLayer.getOptionalIdentifiers(request)
print(ids)
for id in ids:
    print(id, DataAccessLayer.getIdentifierValues(request, id))
# Define Location names
sectors = ["ECONUS"]

# Define creatingEntity Identifiers
entities = ["CLDSNOW", "DBRDUST", "GEOCOLR"]

# Define parameters
ch1 = "CH-01-0.47um"
ch2 = "CH-02-0.64um"
ch3 = "CH-03-0.87um"
channels = [ch1, ch2, ch3]
5.2 Define Output Location
Here we define a folder for where the satellite images will be written to. The default directory is a new folder called ‘output’ that lives whereever this notebook lives.
Tip: If you specify the fully qualified path, it will no longer depend on where this notebook is located. For example (for a Mac):
outputDir = '/Users/awips/test_dir/output/'
# Define name of the desired end directory
outputDir = 'output/'

# Check to see if this folder exists
if not os.path.exists(outputDir):
    # If not, create the directory
    print('Creating new output directory: ',outputDir)
    os.makedirs(outputDir)
else:
    # If so, let the user know
    print('Output directory exists!')
Output directory exists!
5.3 Write Out GOES Images
# First loop through the sectors (location names)
for sector in sectors:

    # Set the location on the request
    request.setLocationNames(sector)

    # Next loop through the Products (entities)
    for entity in entities:
        # Reset the time and channel variables since we're on a new product
        time = None
        R = None
        G = None
        B = None

        # Set the product
        request.addIdentifier("creatingEntity", entity)

        # Cycle through the channels (parameters)
        for channel in channels:
            request.setParameters(channel)

            # Set the time for this product if it hasn't been set
            # If it has been set, then we proceed with that value
            # so that all bands in for the one product are pulled
            # from the same time
            if(time is None):
                times = DataAccessLayer.getAvailableTimes(request)
                time = [times[-1]]
                print("selected time:", time)

            # Request the data from EDEX
            response = DataAccessLayer.getGridData(request, time)
            # Grab the actual data from the response
            grid = response[0]
            # Get the raw data from the response
            data = grid.getRawData()
            reftime = grid.getDataTime().getRefTime()

            # Set the R,G,B channel
            if(channel == ch1):
                B = data
            elif (channel == ch2):
                R = data
            elif (channel == ch3):
                G = data

            # Create the single channel name
            name = outputDir+entity+'-'+sector+'-'+channel+'.png'

            # Write out the single channel
            print('writing',name)
            write_img(data, name, proj, extent, reftime, False)

        # --- End of channel loop

        # Create the RGB product
        # Apply range limits for each channel. RGB values must be between 0 and 1
        R = np.clip(R, 0, 1)
        G = np.clip(G, 0, 1)
        B = np.clip(B, 0, 1)
        RGB = np.dstack([R, G, B])

        # Create RGB name
        rgbName = outputDir+entity+'-'+sector+'-RGB.png'
        # Write out the RGB image
        print('writing', rgbName)
        write_img(RGB, rgbName, proj, extent, time, False)

    # --- End of entity loop
#--- End of sector loop

print('Done!')
selected time: [<DataTime instance: 2021-05-28 06:51:14 >]
writing output/CLDSNOW-ECONUS-CH-01-0.47um.png
writing output/CLDSNOW-ECONUS-CH-02-0.64um.png
writing output/CLDSNOW-ECONUS-CH-03-0.87um.png
writing output/CLDSNOW-ECONUS-RGB.png
selected time: [<DataTime instance: 2021-05-28 06:51:14 >]
writing output/DBRDUST-ECONUS-CH-01-0.47um.png
writing output/DBRDUST-ECONUS-CH-02-0.64um.png
writing output/DBRDUST-ECONUS-CH-03-0.87um.png
writing output/DBRDUST-ECONUS-RGB.png
selected time: [<DataTime instance: 2021-05-28 06:56:14 >]
writing output/GEOCOLR-ECONUS-CH-01-0.47um.png
writing output/GEOCOLR-ECONUS-CH-02-0.64um.png
writing output/GEOCOLR-ECONUS-CH-03-0.87um.png
writing output/GEOCOLR-ECONUS-RGB.png
Done!
<Figure size 432x288 with 0 Axes>
<Figure size 432x288 with 0 Axes>
<Figure size 432x288 with 0 Axes>
6 See Also
6.2 Additional Documentation
CIRA Quick Guides
python-awips
matplotlib
numpy