Note
Click here to download the full example code
Sounding Plotter
This should be run as a script from the command line - not as a notebook.
Download and plot the most recent sounding data for a specified site.
Provides a simple command line interface to specify a site. Using the current UTC time, the script calculates what the most recent sounding should be and requests it from the Wyoming archive using Siphon.
Do the needed imports
import posixpath

import matplotlib.pyplot as plt
import metpy.calc as mpcalc
from metpy.plots import add_metpy_logo, add_timestamp, SkewT
from metpy.units import units
from siphon.simplewebservice.wyoming import WyomingUpperAir
This class encapsulates the code needed to upload an image to Google Drive
class DriveUploader:
    def __init__(self, credsfile='mycreds.txt'):
        from pydrive.drive import GoogleDrive
        self.gdrive = GoogleDrive(self._get_auth(credsfile))

    def _get_auth(self, credsfile):
        from pydrive.auth import GoogleAuth
        gauth = GoogleAuth()

        # Try to load saved client credentials
        gauth.LoadCredentialsFile(credsfile)
        if gauth.credentials is None:
            # Authenticate if they're not there
            gauth.LocalWebserverAuth()
        elif gauth.access_token_expired:
            # Refresh them if expired
            gauth.Refresh()
        else:
            # Initialize the saved creds
            gauth.Authorize()
        # Save the current credentials to a file
        gauth.SaveCredentialsFile(credsfile)
        return gauth

    def _get_first_file_id(self, title, parent, **kwargs):
        query = "title='{}' and '{}' in parents".format(title, parent)
        for k, v in kwargs.items():
            query += " and {}='{}'".format(k, v)
        res = next(self.gdrive.ListFile({'q': query}))
        if res:
            return res[0]['id']
        return None

    def get_folder(self, path):
        parent = 'root'
        for part in path.split('/'):
            if not part:
                continue
            parent = self._get_first_file_id(part, parent,
                                             mimeType='application/vnd.google-apps.folder')
        return parent

    def create_or_get_file(self, path):
        pathname, filename = posixpath.split(path)
        folder = self.get_folder(pathname)
        create_file_args = {'parents': [{'kind': 'drive#fileLink', 'id': folder}]}

        file_id = self._get_first_file_id(filename, folder)
        if file_id is not None:
            create_file_args['id'] = file_id
        return self.gdrive.CreateFile(create_file_args)

    def upload_to(self, local_path, remote_path):
        f = self.create_or_get_file(remote_path)
        f.SetContentFile(local_path)
        f['title'] = posixpath.basename(remote_path)
        f.Upload()
This function takes care of actually generating a skewT from the DataFrame
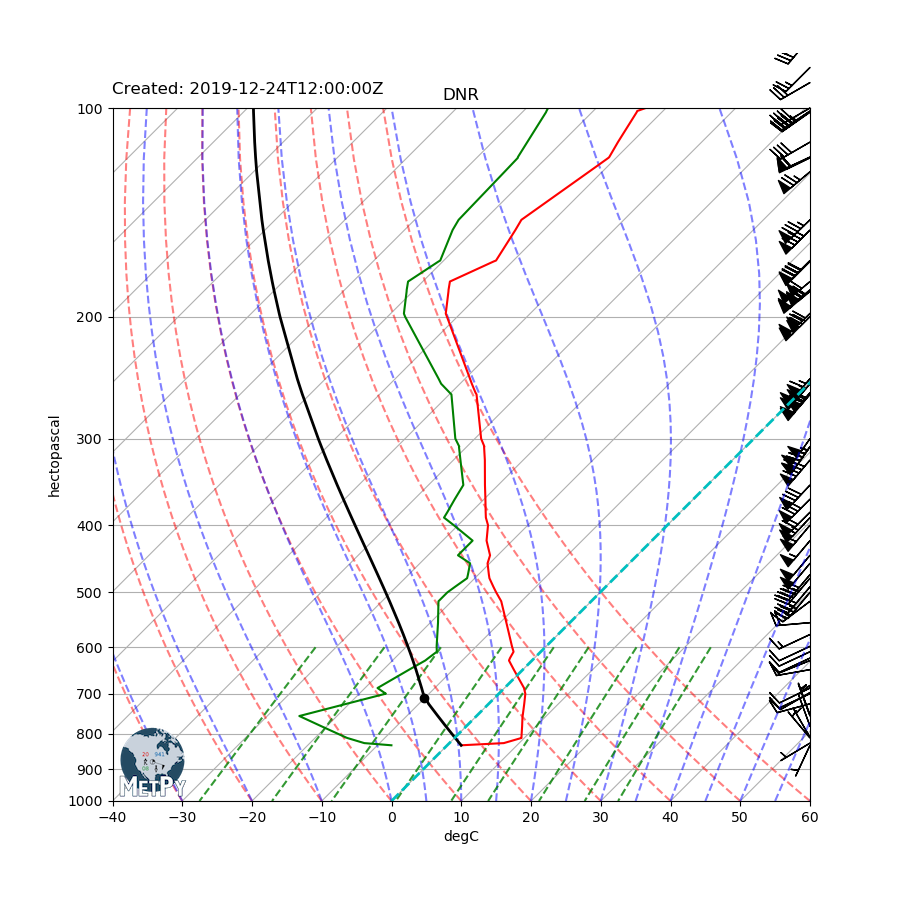
def plot_skewt(df):
    # We will pull the data out of the example dataset into individual variables
    # and assign units.
    p = df['pressure'].values * units.hPa
    T = df['temperature'].values * units.degC
    Td = df['dewpoint'].values * units.degC
    wind_speed = df['speed'].values * units.knots
    wind_dir = df['direction'].values * units.degrees
    u, v = mpcalc.wind_components(wind_speed, wind_dir)

    # Create a new figure. The dimensions here give a good aspect ratio.
    fig = plt.figure(figsize=(9, 9))
    add_metpy_logo(fig, 115, 100)
    skew = SkewT(fig, rotation=45)

    # Plot the data using normal plotting functions, in this case using
    # log scaling in Y, as dictated by the typical meteorological plot
    skew.plot(p, T, 'r')
    skew.plot(p, Td, 'g')
    skew.plot_barbs(p, u, v)
    skew.ax.set_ylim(1000, 100)
    skew.ax.set_xlim(-40, 60)

    # Calculate LCL height and plot as black dot
    lcl_pressure, lcl_temperature = mpcalc.lcl(p[0], T[0], Td[0])
    skew.plot(lcl_pressure, lcl_temperature, 'ko', markerfacecolor='black')

    # Calculate full parcel profile and add to plot as black line
    prof = mpcalc.parcel_profile(p, T[0], Td[0]).to('degC')
    skew.plot(p, prof, 'k', linewidth=2)

    # An example of a slanted line at constant T -- in this case the 0
    # isotherm
    skew.ax.axvline(0, color='c', linestyle='--', linewidth=2)

    # Add the relevant special lines
    skew.plot_dry_adiabats()
    skew.plot_moist_adiabats()
    skew.plot_mixing_lines()

    return skew

def make_name(site, time):
    return '{site}_{dt:%Y%m%d_%H%M}.png'.format(site=site, dt=time)
This is where the command line script will actually enter, and handles parsing command line arguments and driving everything else.
if __name__ == '__main__':
    import argparse
    from datetime import datetime, timedelta
    import tempfile

    # Set up argument parsing for the script. Provides one argument for the site, and another
    # that controls whether the plot should be shown or saved as an image.
    parser = argparse.ArgumentParser(description='Download sounding data and plot.')
    parser.add_argument('-s', '--site', help='Site to obtain data for', type=str,
                        default='DNR')
    parser.add_argument('--show', help='Whether to show the plot rather than save to disk',
                        action='store_true')
    parser.add_argument('-d', '--date', help='Date and time to request data for in YYYYMMDDHH.'
                        ' Defaults to most recent 00/12 hour.', type=str)
    parser.add_argument('-g', '--gdrive', help='Google Drive upload path', type=str)
    parser.add_argument('-f', '--filename', help='Image filename', type=str)
    args = parser.parse_args()

    if args.date:
        request_time = datetime.strptime(args.date, '%Y%m%d%H')
    else:
        # Figure out the most recent sounding, 00 or 12. Subtracting two hours
        # helps ensure that we choose a time with data available.
        now = datetime.utcnow() - timedelta(hours=2)
        request_time = now.replace(hour=(now.hour // 12) * 12, minute=0, second=0)

    # Request the data and plot
    df = WyomingUpperAir.request_data(request_time, args.site)
    skewt = plot_skewt(df)

    # Add the timestamp for the data to the plot
    add_timestamp(skewt.ax, request_time, y=1.02, x=0, ha='left', fontsize='large')
    skewt.ax.set_title(args.site)

    if args.show:
        plt.show()
    else:
        fname = args.filename if args.filename else make_name(args.site, request_time)
        if args.gdrive:
            uploader = DriveUploader()
            with tempfile.NamedTemporaryFile(suffix='.png') as f:
                skewt.ax.figure.savefig(f.name)
                uploader.upload_to(f.name, posixpath.join(args.gdrive, fname))
        else:
            skewt.ax.figure.savefig(make_name(args.site, request_time))
Total running time of the script: ( 0 minutes 1.184 seconds)