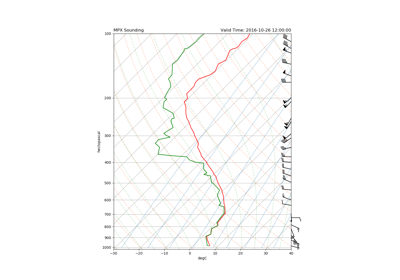
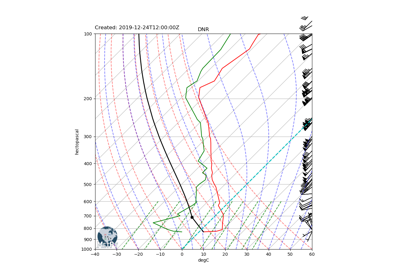
Skew-T Analysis
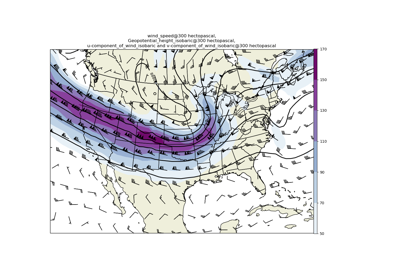
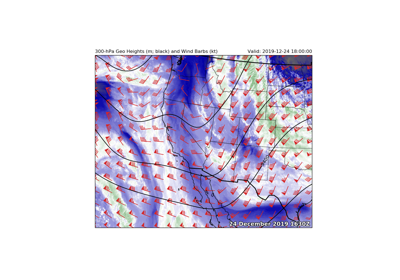
MetPy Declarative - 300 hPa
Using Xarray for Data read and selection
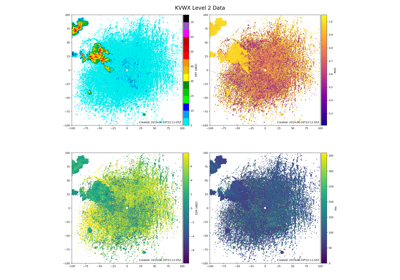
Plotting AWS-hosted NEXRAD Level 2 Data
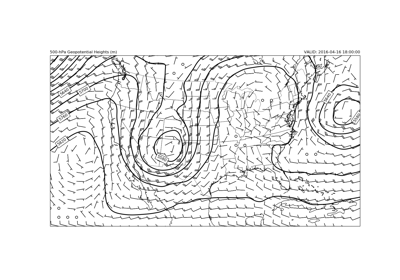
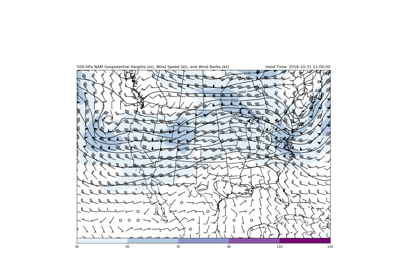
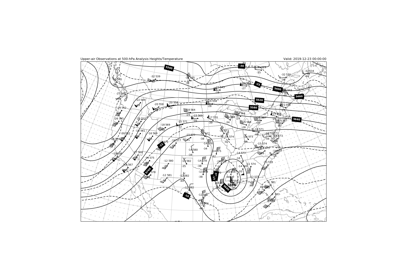
500 hPa Geopotential Heights and Winds
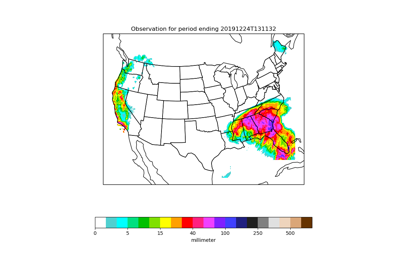
NWS Precipitation Map
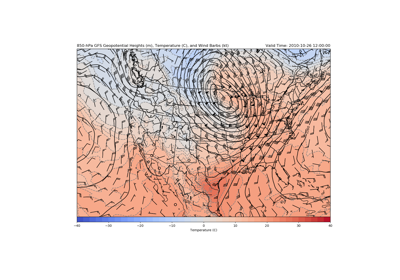
850-hPa Geopotential Heights, Temperature, and Winds
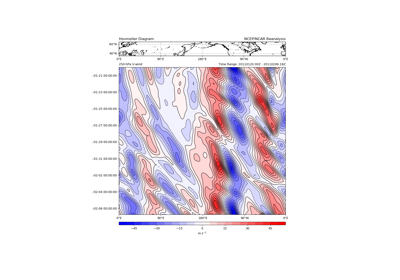
Hovmoller Diagram Example
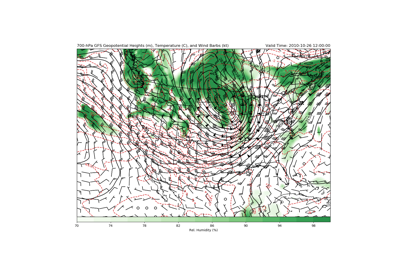
700-hPa Relative Humidity
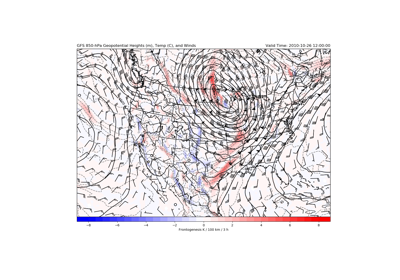
850-hPa Geopotential Heights, Temperature, Frontogenesis, and Winds
Jupyter Notebook Widget Example
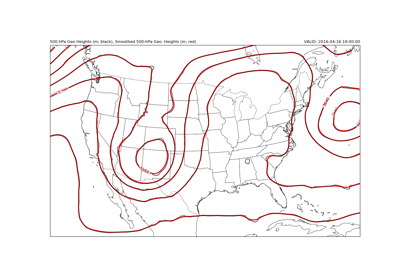
Smoothing Contours
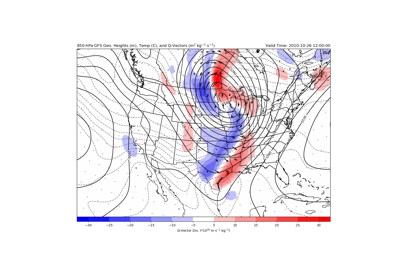
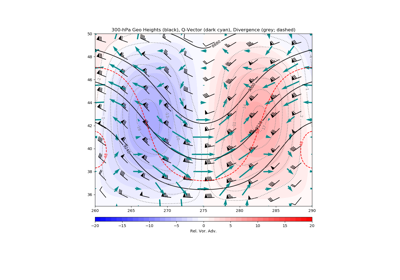
QVector Example
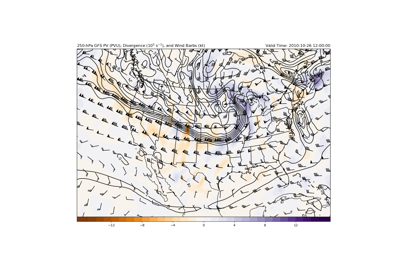
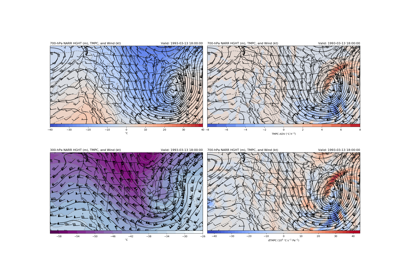
Baroclinic Potential Vorticity Analysis, Divergence, and Winds
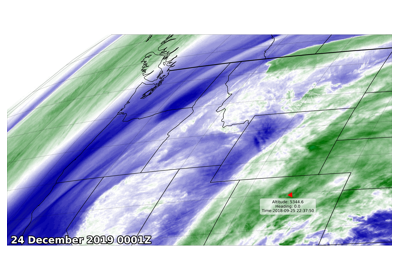
GOES Aircraft Example
WV Satellite Overlay Example
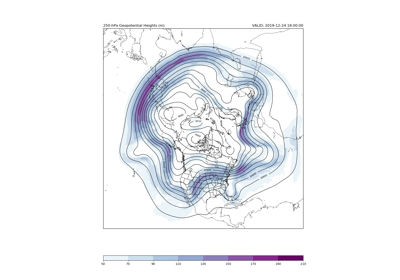
A 250-hPa Hemispheric Map using Python
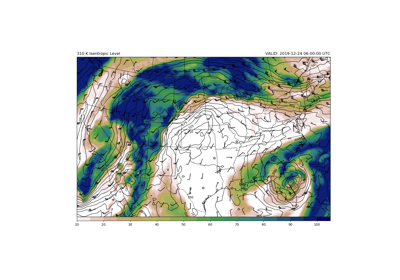
Isentropic Analysis
500 hPa Vorticity Advection
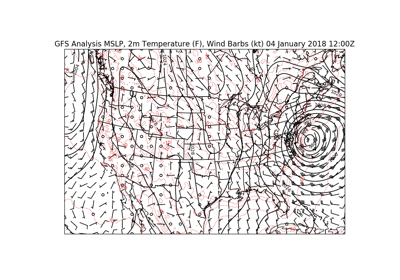
Model Surface Output
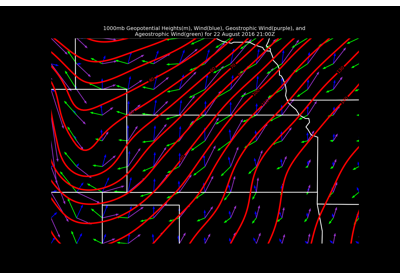
Geostrophic and Ageostrophic Wind
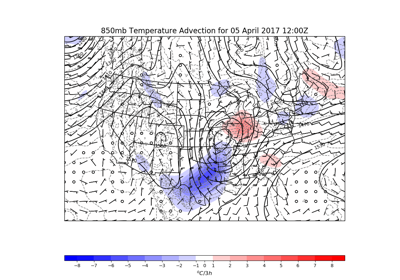
850 hPa Temperature Advection
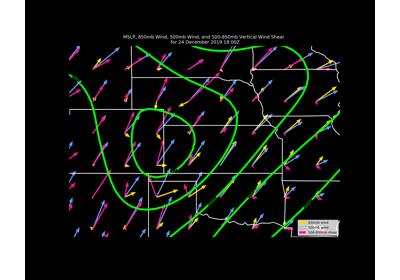
Calculating Wind Shear
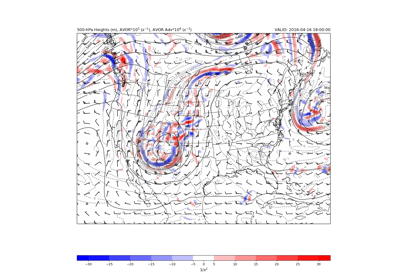
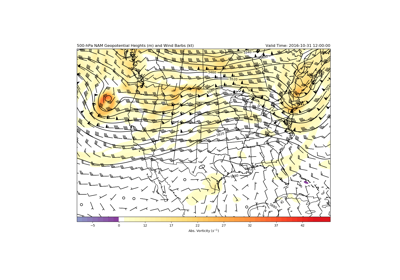
500 hPa Geopotential Heights, Absolute Vorticity, and Winds
Analytic 300-hPa Trough
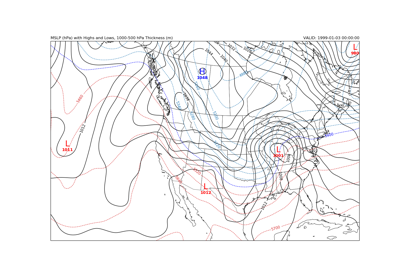
MSLP and 1000-500 hPa Thickness with High and Low Symbols
Sounding Plotter
Differential Temperature Advection with NARR Data
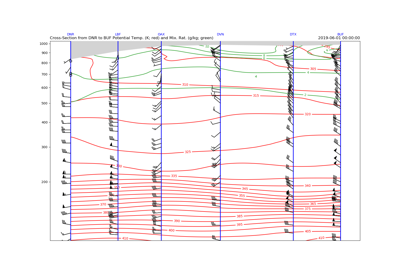
Real Data Cross-Section Example
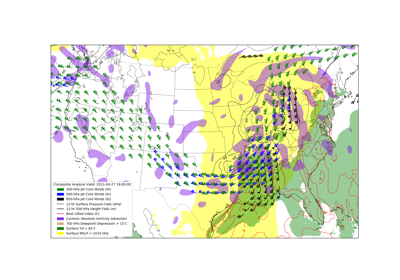
Miller Composite Chart
DIFAX Replication
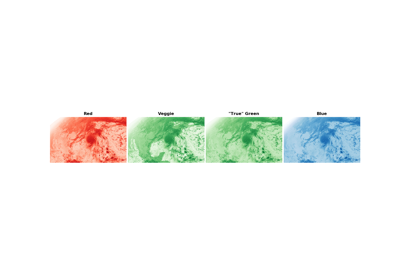
GOES-16: True Color Recipe
Hurricane Tracker with NHC Data
Gallery generated by Sphinx-Gallery