Note
Click here to download the full example code
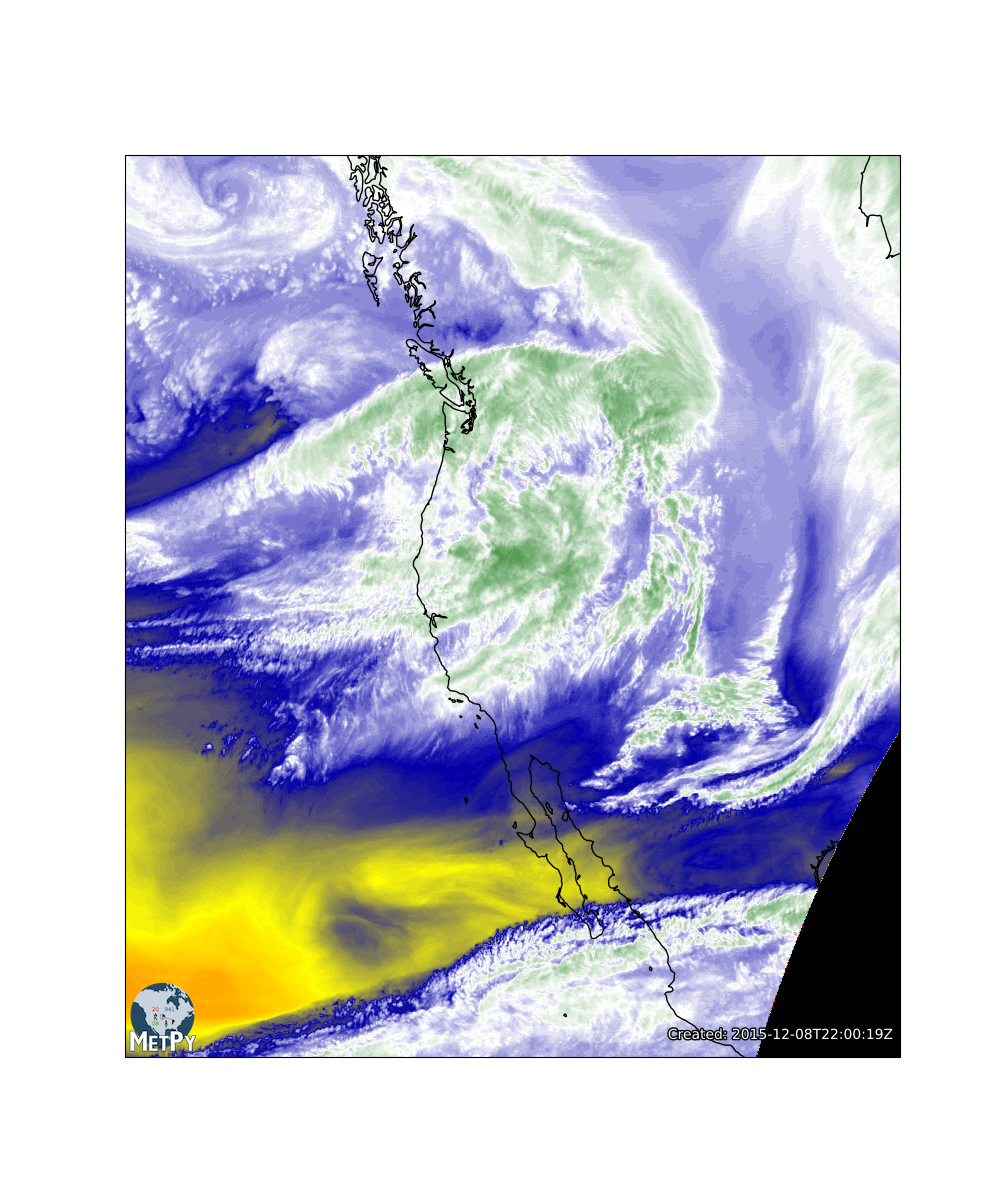
GINI Water Vapor Imagery
Use MetPy’s support for GINI files to read in a water vapor satellite image and plot the data using CartoPy.
import cartopy.feature as cfeature
import matplotlib.pyplot as plt
import xarray as xr

from metpy.cbook import get_test_data
from metpy.io import GiniFile
from metpy.plots import add_metpy_logo, add_timestamp, colortables
Out:
GiniFile: GOES-15 West CONUS WV (6.5/6.7 micron)
        Time: 2015-12-08 22:00:19
        Size: 1280x1100
        Projection: lambert_conformal
        Lower Left Corner (Lon, Lat): (-133.4588, 12.19)
        Resolution: 4km
Get a Dataset view of the data (essentially a NetCDF-like interface to the underlying data). Pull out the data and (x, y) coordinates. We use metpy.parse_cf to handle parsing some netCDF Climate and Forecasting (CF) metadata to simplify working with projections.
ds = xr.open_dataset(f)
x = ds.variables['x'][:]
y = ds.variables['y'][:]
dat = ds.metpy.parse_cf('WV')
Plot the image. We use MetPy’s xarray/cartopy integration to automatically handle parsing the projection information.
fig = plt.figure(figsize=(10, 12))
add_metpy_logo(fig, 125, 145)
ax = fig.add_subplot(1, 1, 1, projection=dat.metpy.cartopy_crs)
wv_norm, wv_cmap = colortables.get_with_range('WVCIMSS', 100, 260)
wv_cmap.set_under('k')
im = ax.imshow(dat[:], cmap=wv_cmap, norm=wv_norm,
               extent=(x.min(), x.max(), y.min(), y.max()), origin='upper')
ax.add_feature(cfeature.COASTLINE.with_scale('50m'))
add_timestamp(ax, f.prod_desc.datetime, y=0.02, high_contrast=True)

plt.show()
Total running time of the script: ( 0 minutes 0.758 seconds)