fig, axes = plt.subplots(1, 2, figsize=(15, 8))
for v, ctable, ax in zip(('N0Q', 'N0U'), ('NWSReflectivity', 'NWSVelocity'), axes):
# Open the file
name = get_test_data('nids/KOUN_SDUS54_%sTLX_201305202016' % v, as_file_obj=False)
f = Level3File(name)
# Pull the data out of the file object
datadict = f.sym_block[0][0]
# Turn into an array, then mask
data = ma.array(datadict['data'])
data[data==0] = ma.masked
# Grab azimuths and calculate a range based on number of gates
az = np.array(datadict['start_az'] + [datadict['end_az'][-1]])
rng = np.linspace(0, f.max_range, data.shape[-1] + 1)
# Convert az,range to x,y
xlocs = rng * np.sin(np.deg2rad(az[:, np.newaxis]))
ylocs = rng * np.cos(np.deg2rad(az[:, np.newaxis]))
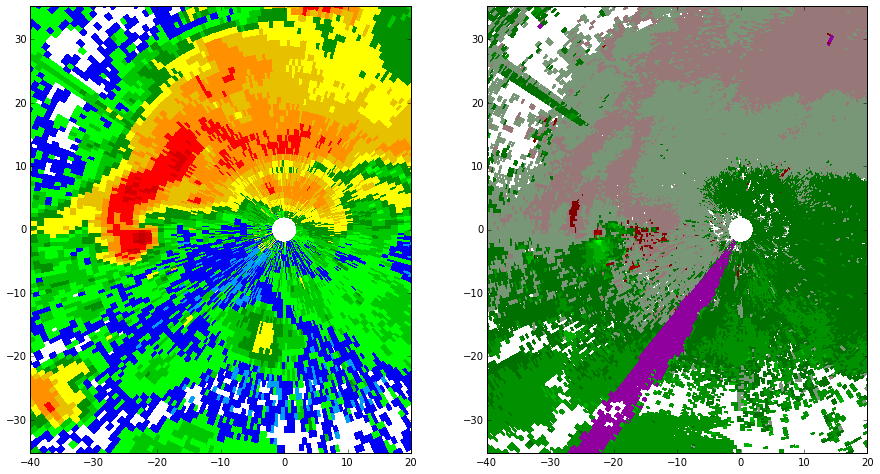
# Plot the data
norm, cmap = ctables.registry.get_with_steps(ctable, 16, 16)
ax.pcolormesh(xlocs, ylocs, data, norm=norm, cmap=cmap)
ax.set_aspect('equal', 'datalim')
ax.set_xlim(-40, 20)
ax.set_ylim(-30, 30)
plt.show()