GINI Water Vapor
import numpy as np
import matplotlib.pyplot as plt
import cartopy.crs as ccrs

from metpy.cbook import get_test_data
from metpy.io.gini import GiniFile
from metpy.plots.ctables import registry

%matplotlib inline
# Open the GINI file from the test data
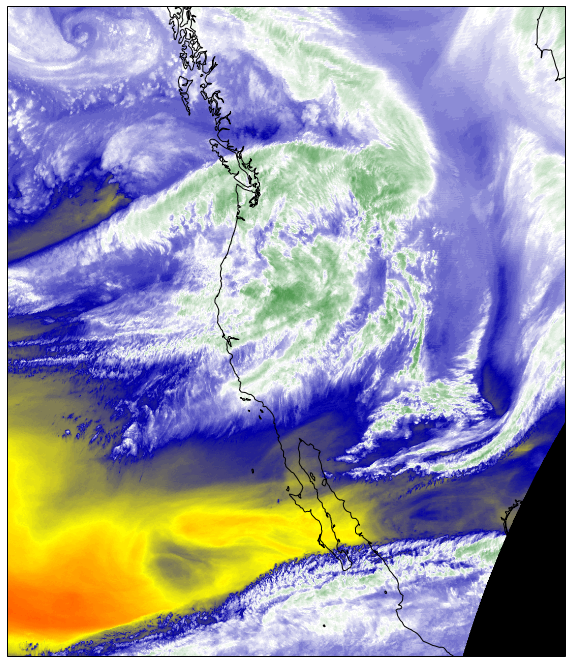
f = GiniFile(get_test_data('WEST-CONUS_4km_WV_20151208_2200.gini'))
print(f)
GiniFile: GOES-15 West CONUS WV (6.5/6.7 micron)
    Time: 2015-12-08 22:00:19
    Size: 1280x1100
    Projection: lambert_conformal
    Lower Left Corner (Lon, Lat): (-133.4588, 12.19)
    Resolution: 4km
# Get a Dataset view of the data (essentially a NetCDF-like interface to the
# underlying data). Pull out the data, (x, y) coordinates, and the projection
# information.
ds = f.to_dataset()
x = ds.variables['x'][:]
y = ds.variables['y'][:]
dat = ds.variables['WV']
proj_var = ds.variables[dat.grid_mapping]
print(proj_var)
<class 'metpy.io.cdm.Variable'>: int32 Lambert_Conformal()
    grid_mapping_name: lambert_conformal_conic
    standard_parallel: 25.0
    longitude_of_central_meridian: -95.0
    latitude_of_projection_origin: 25.0
    earth_radius: 6371200.0
# Create CartoPy projection information for the file
globe = ccrs.Globe(ellipse='sphere', semimajor_axis=proj_var.earth_radius,
                   semiminor_axis=proj_var.earth_radius)
proj = ccrs.LambertConformal(central_longitude=proj_var.longitude_of_central_meridian,
                             central_latitude=proj_var.latitude_of_projection_origin,
                             standard_parallels=[proj_var.standard_parallel],
                             globe=globe)
# Plot the image
fig = plt.figure(figsize=(10, 20))
ax = fig.add_subplot(1, 1, 1, projection=proj)
wv_norm, wv_cmap = registry.get_with_steps('WVCIMSS', 0, 1)
im = ax.imshow(dat[:], cmap=wv_cmap, norm=wv_norm, zorder=0,
               extent=(x.min(), x.max(), y.min(), y.max()), origin='upper')
ax.coastlines(resolution='50m', zorder=2, color='black')
<cartopy.mpl.feature_artist.FeatureArtist at 0x10a62bcf8>
/Users/rmay/miniconda3/envs/metpy3/lib/python3.4/site-packages/matplotlib/artist.py:221: MatplotlibDeprecationWarning: This has been deprecated in mpl 1.5, please use the
axes property.  A removal date has not been set.
  warnings.warn(_get_axes_msg, mplDeprecation, stacklevel=1)