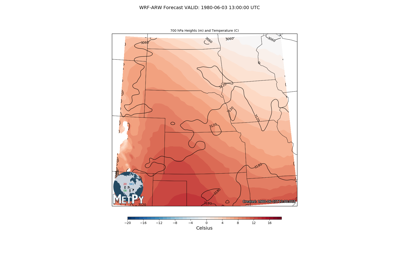
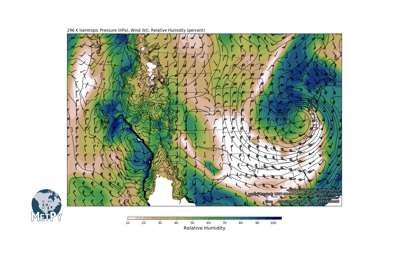
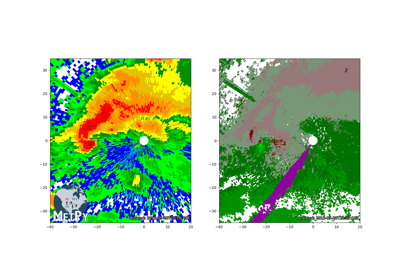
add_timestamp
-
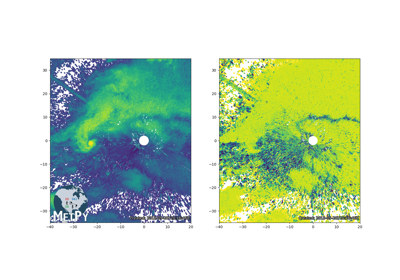
metpy.plots.add_timestamp(ax, time=None, x=0.99, y=-0.04, ha='right', high_contrast=False, pretext='Created: ', time_format='%Y-%m-%dT%H:%M:%SZ', **kwargs)[source]¶ Add a timestamp to a plot.
Adds a timestamp to a plot, defaulting to the time of plot creation in ISO format.
- Parameters
ax (
matplotlib.axes.Axes) – The Axes instance used for plottingtime (
datetime.datetime) – Specific time to be plotted - datetime.utcnow will be use if not specifiedx (float) – Relative x position on the axes of the timestamp
y (float) – Relative y position on the axes of the timestamp
ha (str) – Horizontal alignment of the time stamp string
high_contrast (bool) – Outline text for increased contrast
pretext (str) – Text to appear before the timestamp, optional. Defaults to ‘Created: ‘
time_format (str) – Display format of time, optional. Defaults to ISO format.
- Returns
matplotlib.text.Text– Thematplotlib.text.Textinstance created
