Note
Go to the end to download the full example code.
NDBC Latest Data Request
This example shows how to use siphon’s simplewebswervice support query the most recent observations from all of the NDBC buoys at once.
import cartopy.crs as ccrs
import cartopy.feature as cfeature
import matplotlib.pyplot as plt

from siphon.simplewebservice.ndbc import NDBC
Get a pandas data frame of all of the observations
In this case I’m going to drop buoys that do not have water temperature measurements.
df.dropna(subset=['water_temperature'], inplace=True)
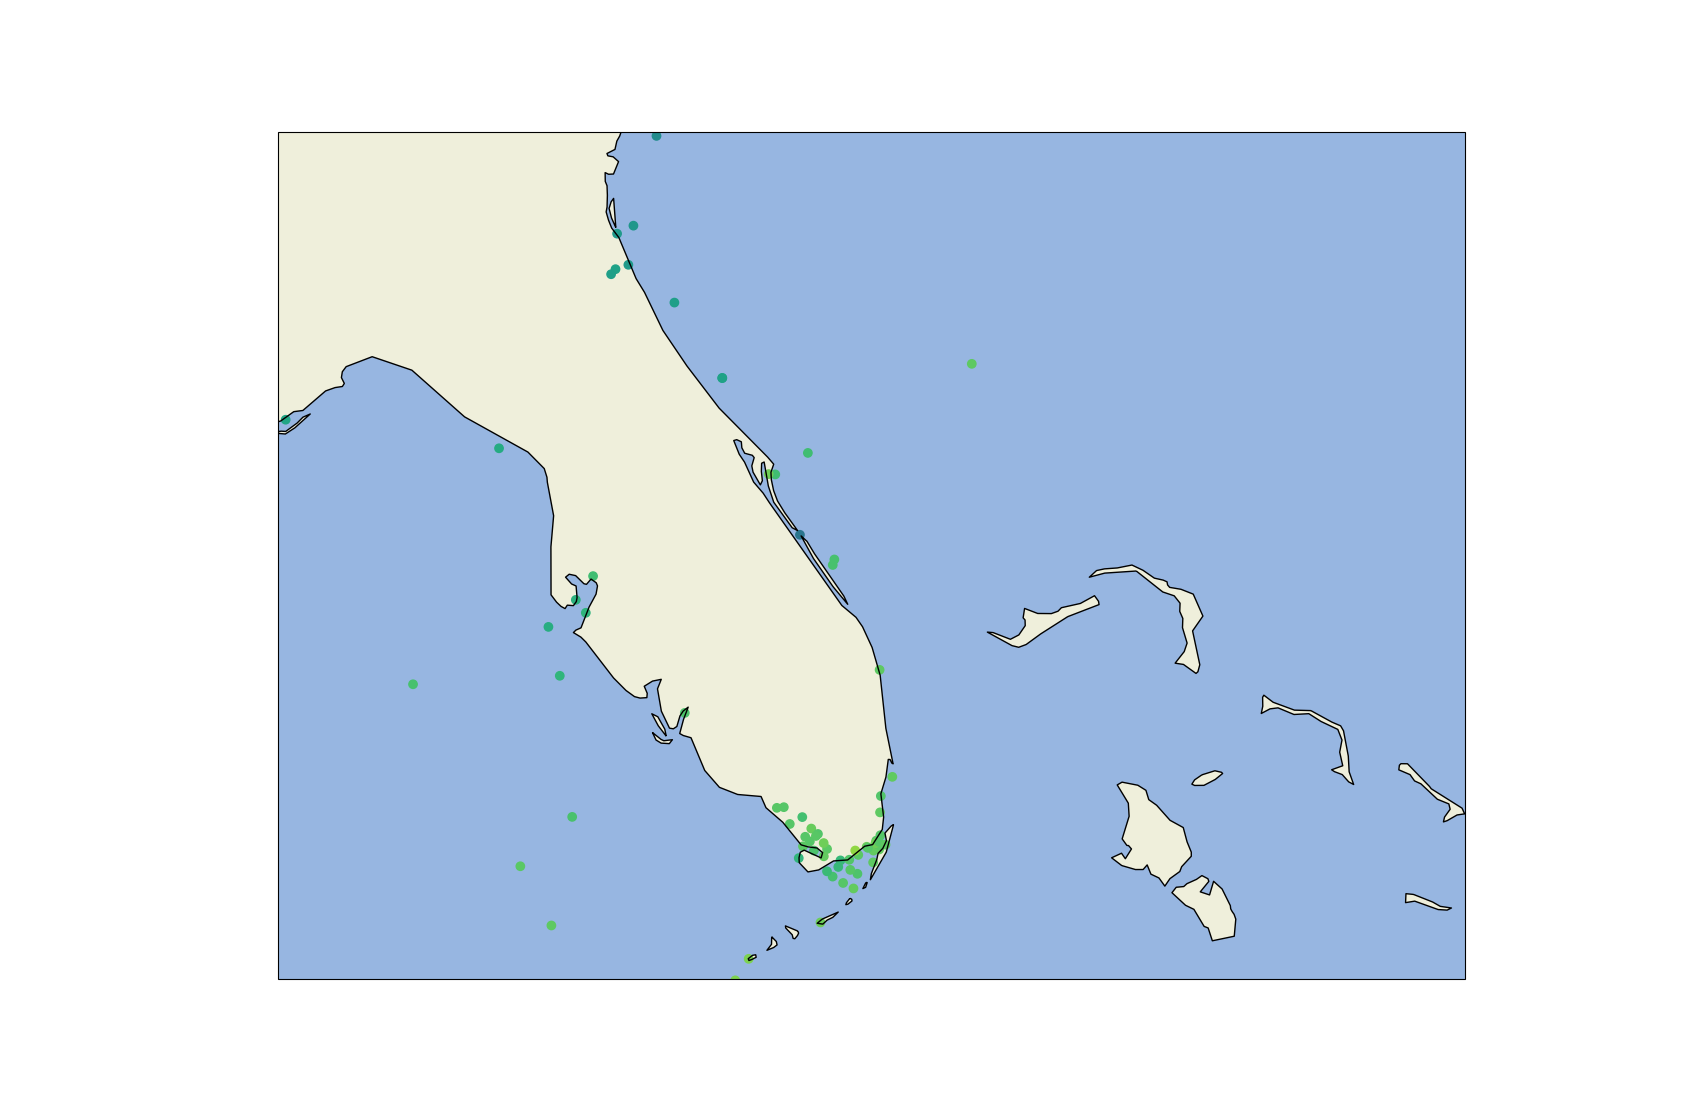
Let’s make a simple plot of the buoy positions and color by water temperature
proj = ccrs.LambertConformal(central_latitude=45., central_longitude=-100.,
                             standard_parallels=[30, 60])

fig = plt.figure(figsize=(17., 11.))
ax = plt.axes(projection=proj)
ax.coastlines('50m', edgecolor='black')
ax.add_feature(cfeature.OCEAN.with_scale('50m'))
ax.add_feature(cfeature.LAND.with_scale('50m'))
ax.set_extent([-85, -75, 25, 30], ccrs.PlateCarree())

ax.scatter(df['longitude'], df['latitude'], c=df['water_temperature'],
           transform=ccrs.PlateCarree())

plt.show()
Total running time of the script: (0 minutes 4.647 seconds)