k_index#
- metpy.calc.k_index(pressure, temperature, dewpoint, vertical_dim=0)[source]#
Calculate K Index from the pressure temperature and dewpoint.
K Index formula derived from [George1960]:
\[K = (T850 - T500) + Td850 - (T700 - Td700)\]where:
\(T850\) is the temperature at 850 hPa
\(T700\) is the temperature at 700 hPa
\(T500\) is the temperature at 500 hPa
\(Td850\) is the dewpoint at 850 hPa
\(Td700\) is the dewpoint at 700 hPa
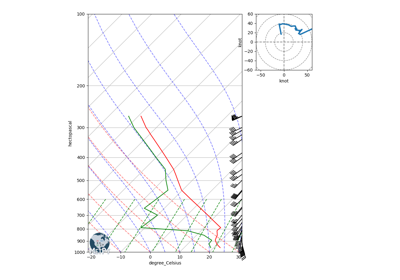
Calculation of the K Index is defined as the temperature difference between the static instability between 850 hPa and 500 hPa, add with the moisture at 850hPa, then subtract from the dryness of the airmass at 700 hPa.
- Parameters:
pressure (
pint.Quantity) – Pressure level(s), in order from highest to lowest pressuretemperature (
pint.Quantity) – Temperature corresponding to pressuredewpoint (
pint.Quantity) – Dewpoint temperature corresponding to pressurevertical_dim (int, optional) – The axis corresponding to vertical, defaults to 0. Automatically determined from xarray DataArray arguments.
- Returns:
pint.Quantity– K Index
Examples
>>> from metpy.calc import dewpoint_from_relative_humidity, k_index
>>> from metpy.units import units
>>> # pressure
>>> p = [1008., 1000., 950., 900., 850., 800., 750., 700., 650., 600.,
...      550., 500., 450., 400., 350., 300., 250., 200.,
...      175., 150., 125., 100., 80., 70., 60., 50.,
...      40., 30., 25., 20.] * units.hPa
>>> # temperature
>>> T = [29.3, 28.1, 23.5, 20.9, 18.4, 15.9, 13.1, 10.1, 6.7, 3.1,
...      -0.5, -4.5, -9.0, -14.8, -21.5, -29.7, -40.0, -52.4,
...      -59.2, -66.5, -74.1, -78.5, -76.0, -71.6, -66.7, -61.3,
...      -56.3, -51.7, -50.7, -47.5] * units.degC
>>> # relative humidity
>>> rh = [.85, .65, .36, .39, .82, .72, .75, .86, .65, .22, .52,
...       .66, .64, .20, .05, .75, .76, .45, .25, .48, .76, .88,
...       .56, .88, .39, .67, .15, .04, .94, .35] * units.dimensionless
>>> # calculate dewpoint
>>> Td = dewpoint_from_relative_humidity(T, rh)
>>> k_index(p, T, Td)
<Quantity(35.9395759, 'degree_Celsius')>


