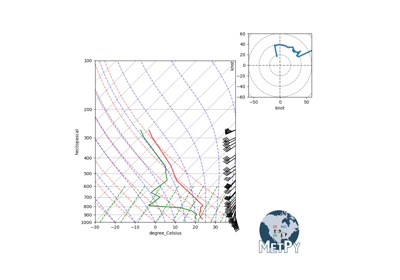
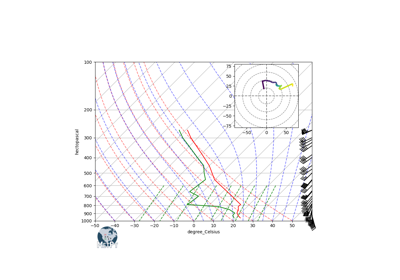
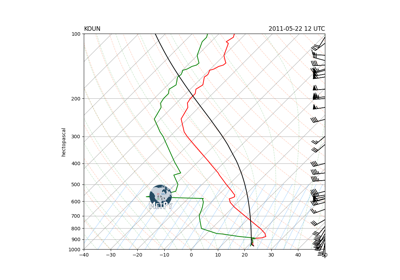
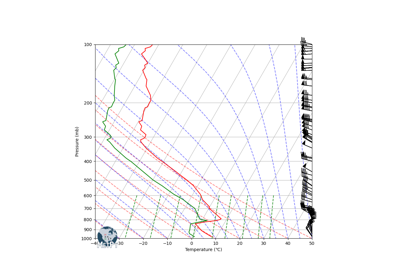
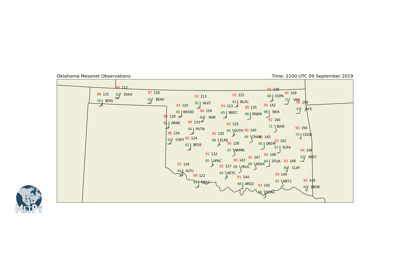
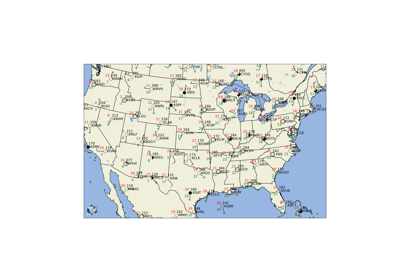
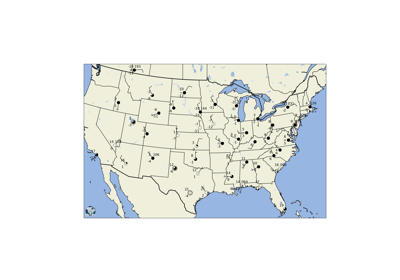
add_metpy_logo#
- metpy.plots.add_metpy_logo(fig, x=10, y=25, zorder=100, size='small', **kwargs)#
Add the MetPy logo to a figure.
Adds an image of the MetPy logo to the figure.
- Parameters
fig (
matplotlib.figure) – The figure instance used for plottingx (int) – x position padding in pixels
y (float) – y position padding in pixels
zorder (int) – The zorder of the logo
size (str) – Size of logo to be used. Can be ‘small’ for 75 px square or ‘large’ for 150 px square.
- Returns
matplotlib.image.FigureImage– Thematplotlib.image.FigureImageinstance created
