Note
Click here to download the full example code
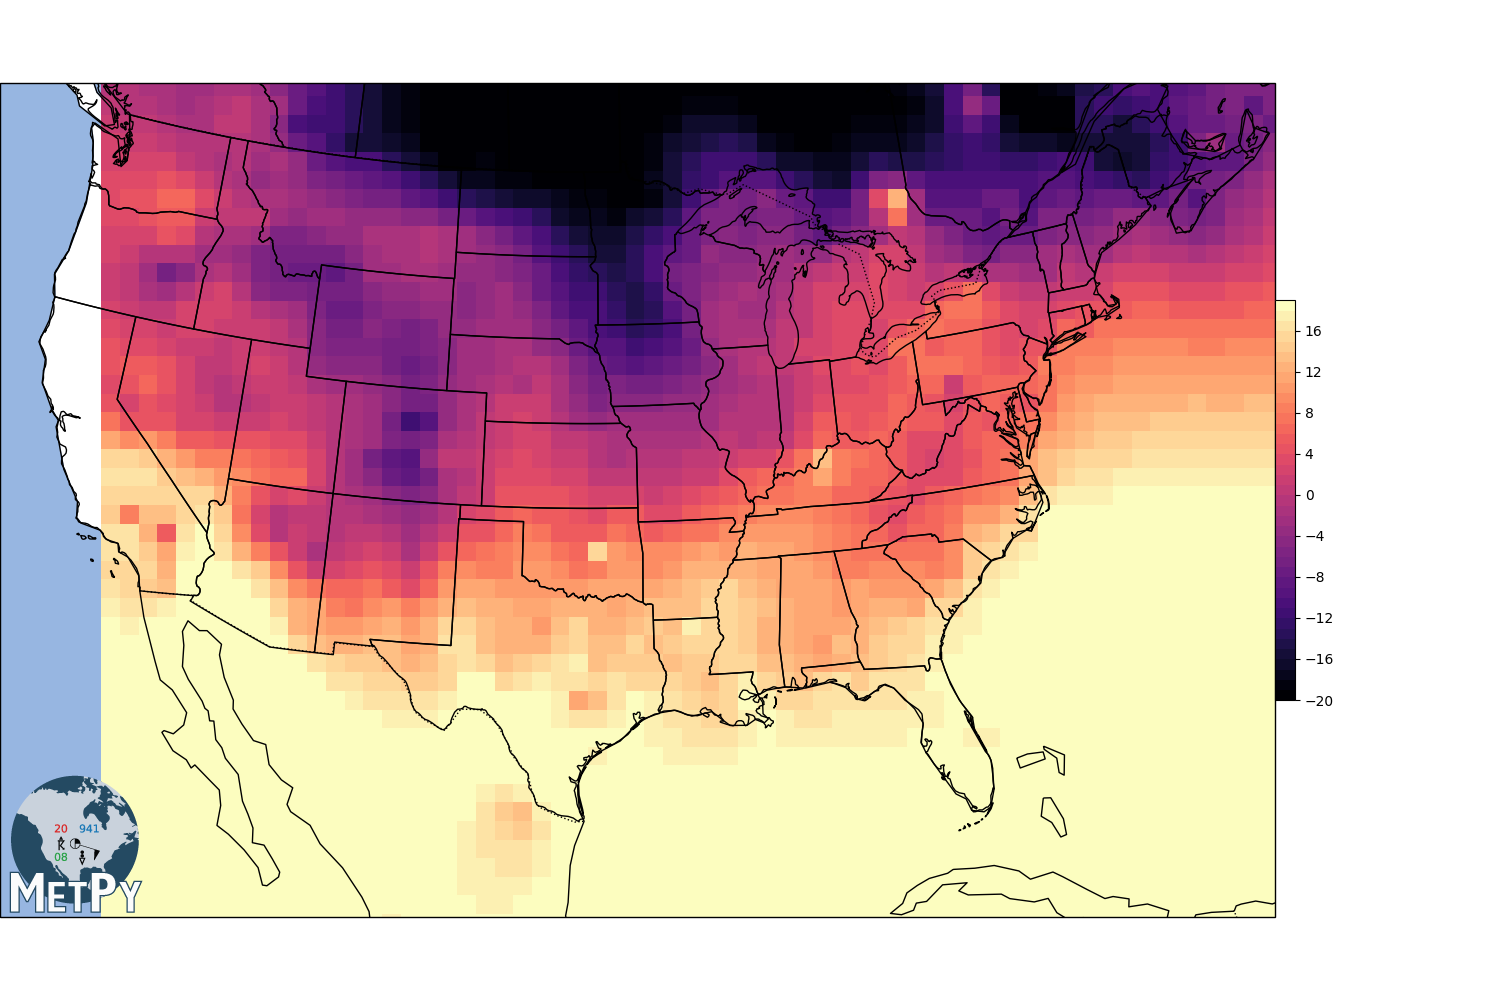
Point Interpolation
Compares different point interpolation approaches.
import cartopy.crs as ccrs
import cartopy.feature as cfeature
from matplotlib.colors import BoundaryNorm
import matplotlib.pyplot as plt
import numpy as np

from metpy.cbook import get_test_data
from metpy.interpolate import (interpolate_to_grid, remove_nan_observations,
                               remove_repeat_coordinates)
from metpy.plots import add_metpy_logo
def basic_map(proj):
    """Make our basic default map for plotting"""
    fig = plt.figure(figsize=(15, 10))
    add_metpy_logo(fig, 0, 80, size='large')
    view = fig.add_axes([0, 0, 1, 1], projection=proj)
    view._hold = True  # Work-around for CartoPy 0.16/Matplotlib 3.0.0 incompatibility
    view.set_extent([-120, -70, 20, 50])
    view.add_feature(cfeature.STATES.with_scale('50m'))
    view.add_feature(cfeature.OCEAN)
    view.add_feature(cfeature.COASTLINE)
    view.add_feature(cfeature.BORDERS, linestyle=':')
    return fig, view


def station_test_data(variable_names, proj_from=None, proj_to=None):
    with get_test_data('station_data.txt') as f:
        all_data = np.loadtxt(f, skiprows=1, delimiter=',',
                              usecols=(1, 2, 3, 4, 5, 6, 7, 17, 18, 19),
                              dtype=np.dtype([('stid', '3S'), ('lat', 'f'), ('lon', 'f'),
                                              ('slp', 'f'), ('air_temperature', 'f'),
                                              ('cloud_fraction', 'f'), ('dewpoint', 'f'),
                                              ('weather', '16S'),
                                              ('wind_dir', 'f'), ('wind_speed', 'f')]))

    all_stids = [s.decode('ascii') for s in all_data['stid']]

    data = np.concatenate([all_data[all_stids.index(site)].reshape(1, ) for site in all_stids])

    value = data[variable_names]
    lon = data['lon']
    lat = data['lat']

    if proj_from is not None and proj_to is not None:

        try:

            proj_points = proj_to.transform_points(proj_from, lon, lat)
            return proj_points[:, 0], proj_points[:, 1], value

        except Exception as e:

            print(e)
            return None

    return lon, lat, value


from_proj = ccrs.Geodetic()
to_proj = ccrs.AlbersEqualArea(central_longitude=-97.0000, central_latitude=38.0000)

levels = list(range(-20, 20, 1))
cmap = plt.get_cmap('magma')
norm = BoundaryNorm(levels, ncolors=cmap.N, clip=True)

x, y, temp = station_test_data('air_temperature', from_proj, to_proj)

x, y, temp = remove_nan_observations(x, y, temp)
x, y, temp = remove_repeat_coordinates(x, y, temp)
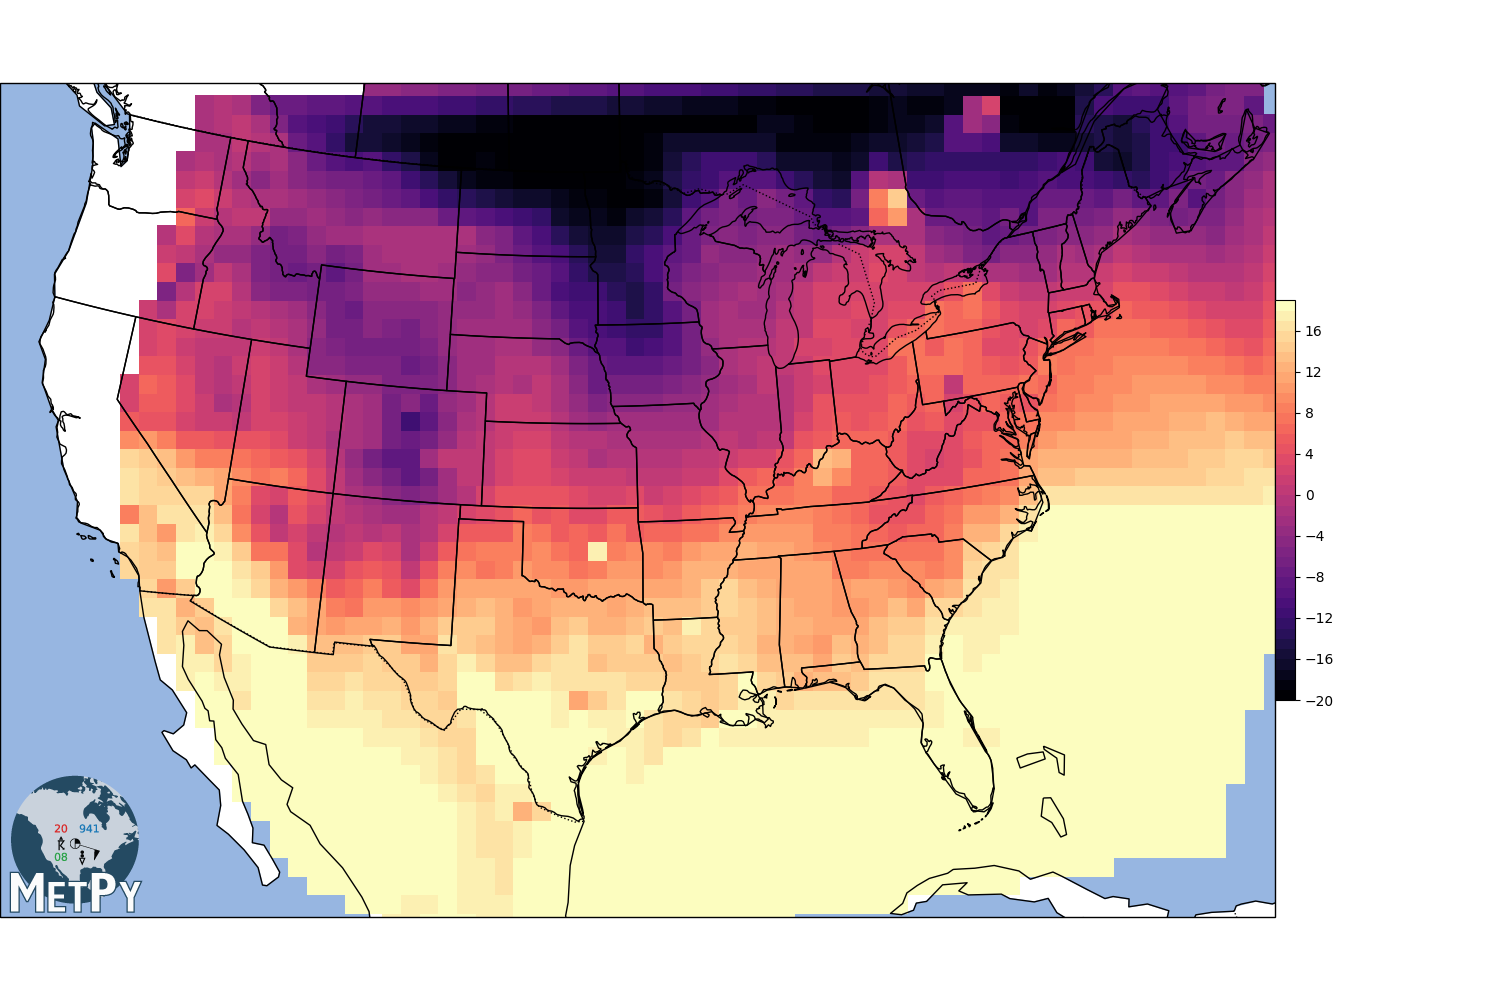
Scipy.interpolate linear
gx, gy, img = interpolate_to_grid(x, y, temp, interp_type='linear', hres=75000)
img = np.ma.masked_where(np.isnan(img), img)
fig, view = basic_map(to_proj)
mmb = view.pcolormesh(gx, gy, img, cmap=cmap, norm=norm)
fig.colorbar(mmb, shrink=.4, pad=0, boundaries=levels)
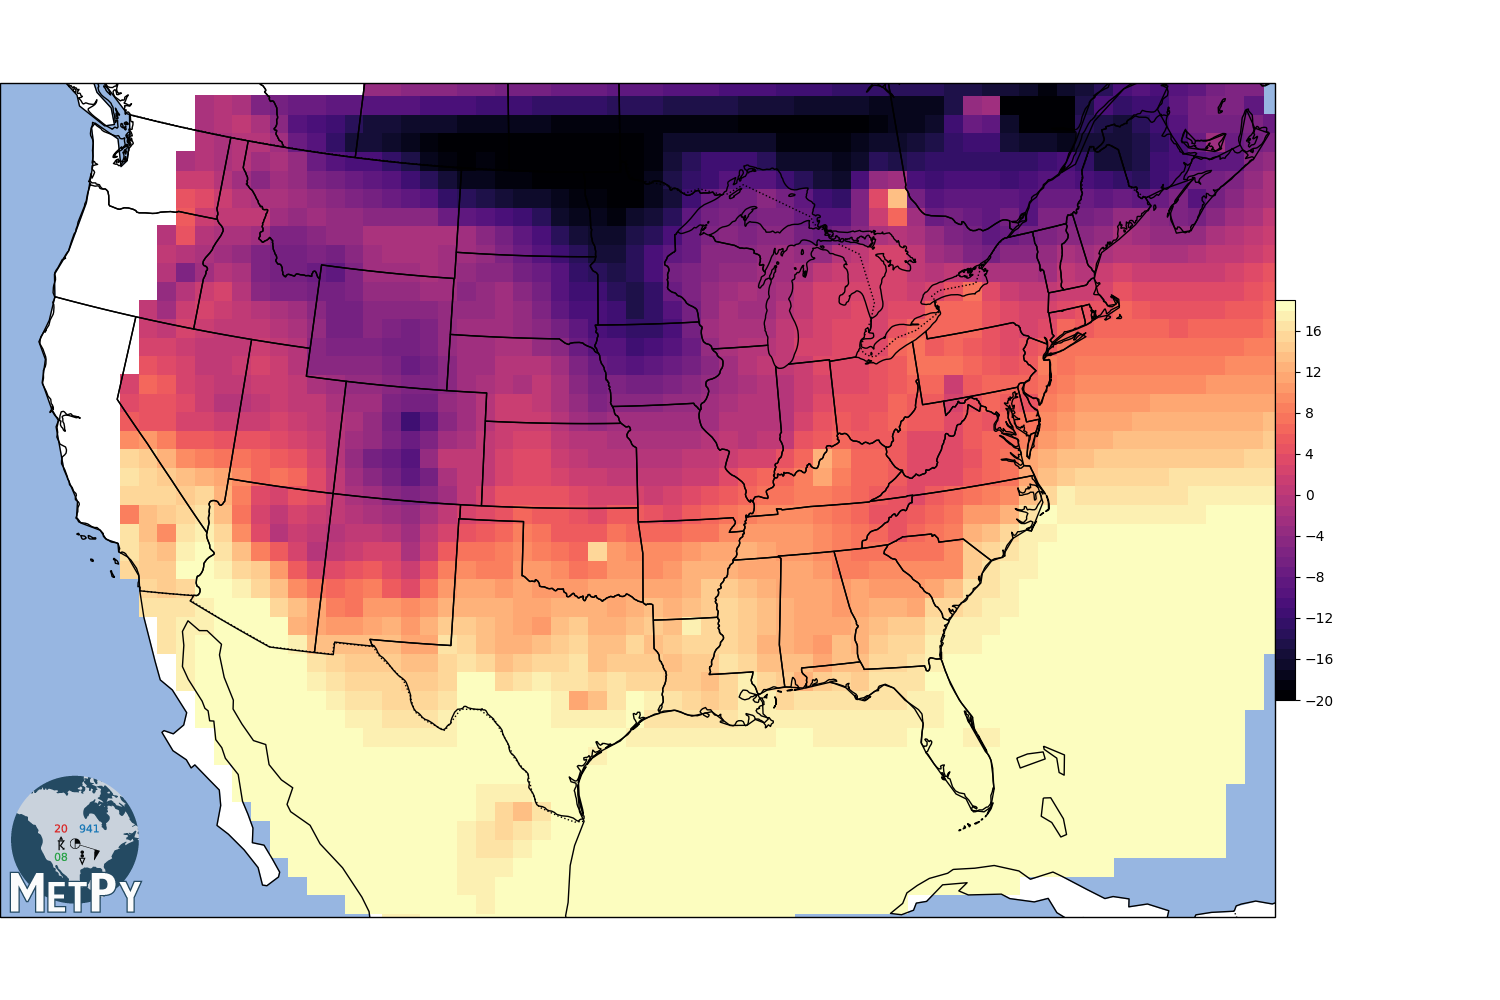
Natural neighbor interpolation (MetPy implementation)
gx, gy, img = interpolate_to_grid(x, y, temp, interp_type='natural_neighbor', hres=75000)
img = np.ma.masked_where(np.isnan(img), img)
fig, view = basic_map(to_proj)
mmb = view.pcolormesh(gx, gy, img, cmap=cmap, norm=norm)
fig.colorbar(mmb, shrink=.4, pad=0, boundaries=levels)
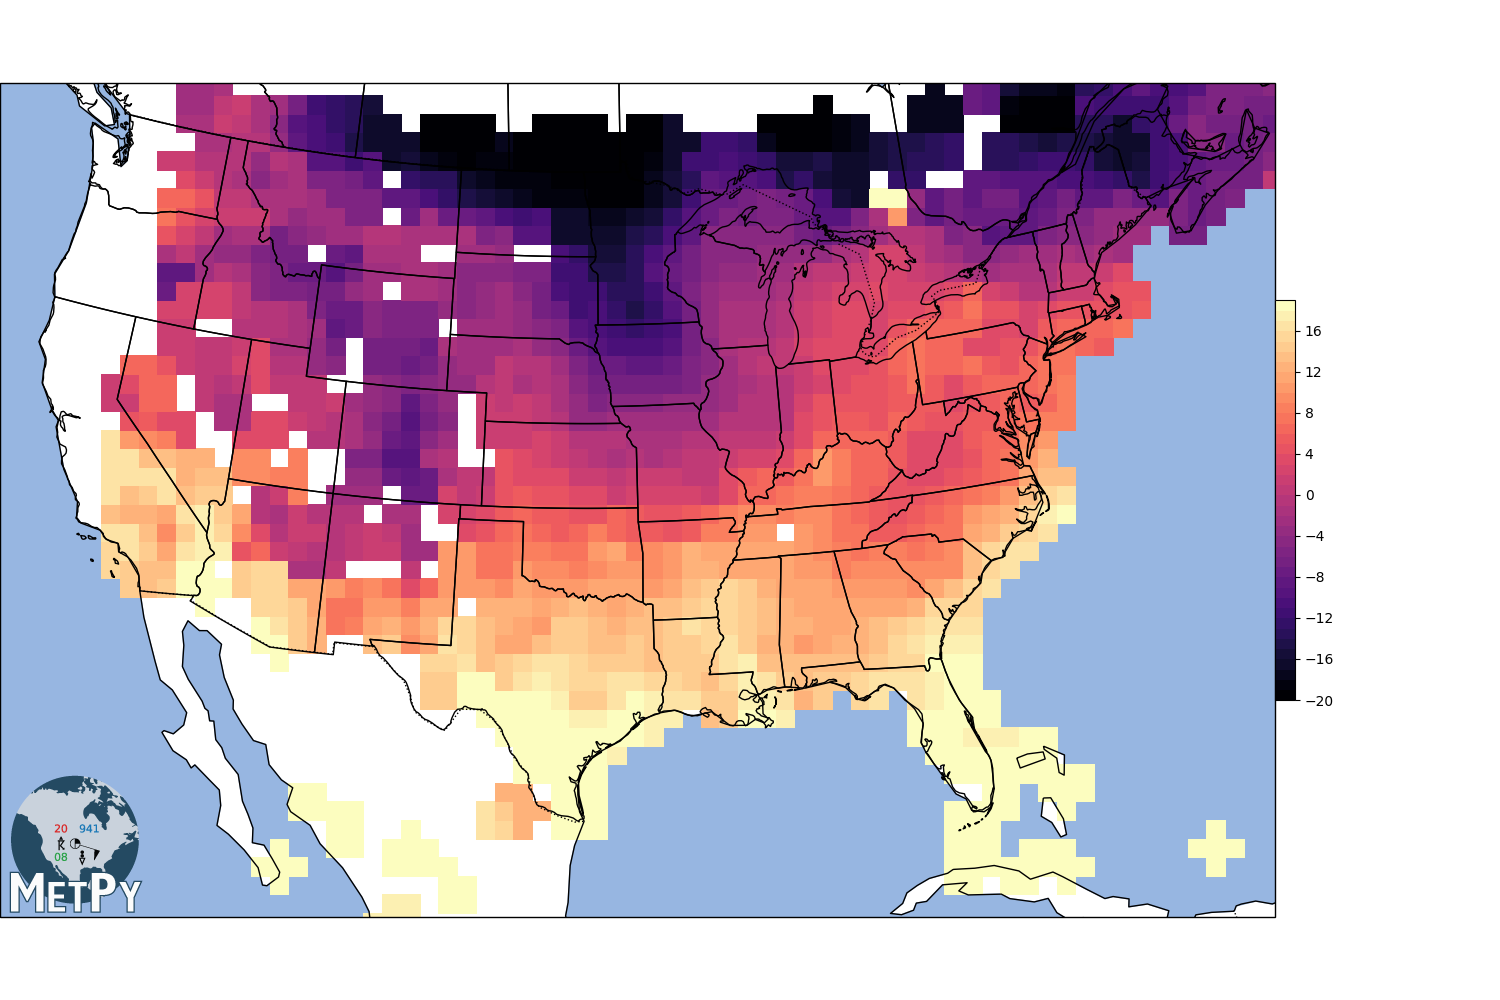
Cressman interpolation
search_radius = 100 km
grid resolution = 25 km
min_neighbors = 1
gx, gy, img = interpolate_to_grid(x, y, temp, interp_type='cressman', minimum_neighbors=1,
                                  hres=75000, search_radius=100000)
img = np.ma.masked_where(np.isnan(img), img)
fig, view = basic_map(to_proj)
mmb = view.pcolormesh(gx, gy, img, cmap=cmap, norm=norm)
fig.colorbar(mmb, shrink=.4, pad=0, boundaries=levels)
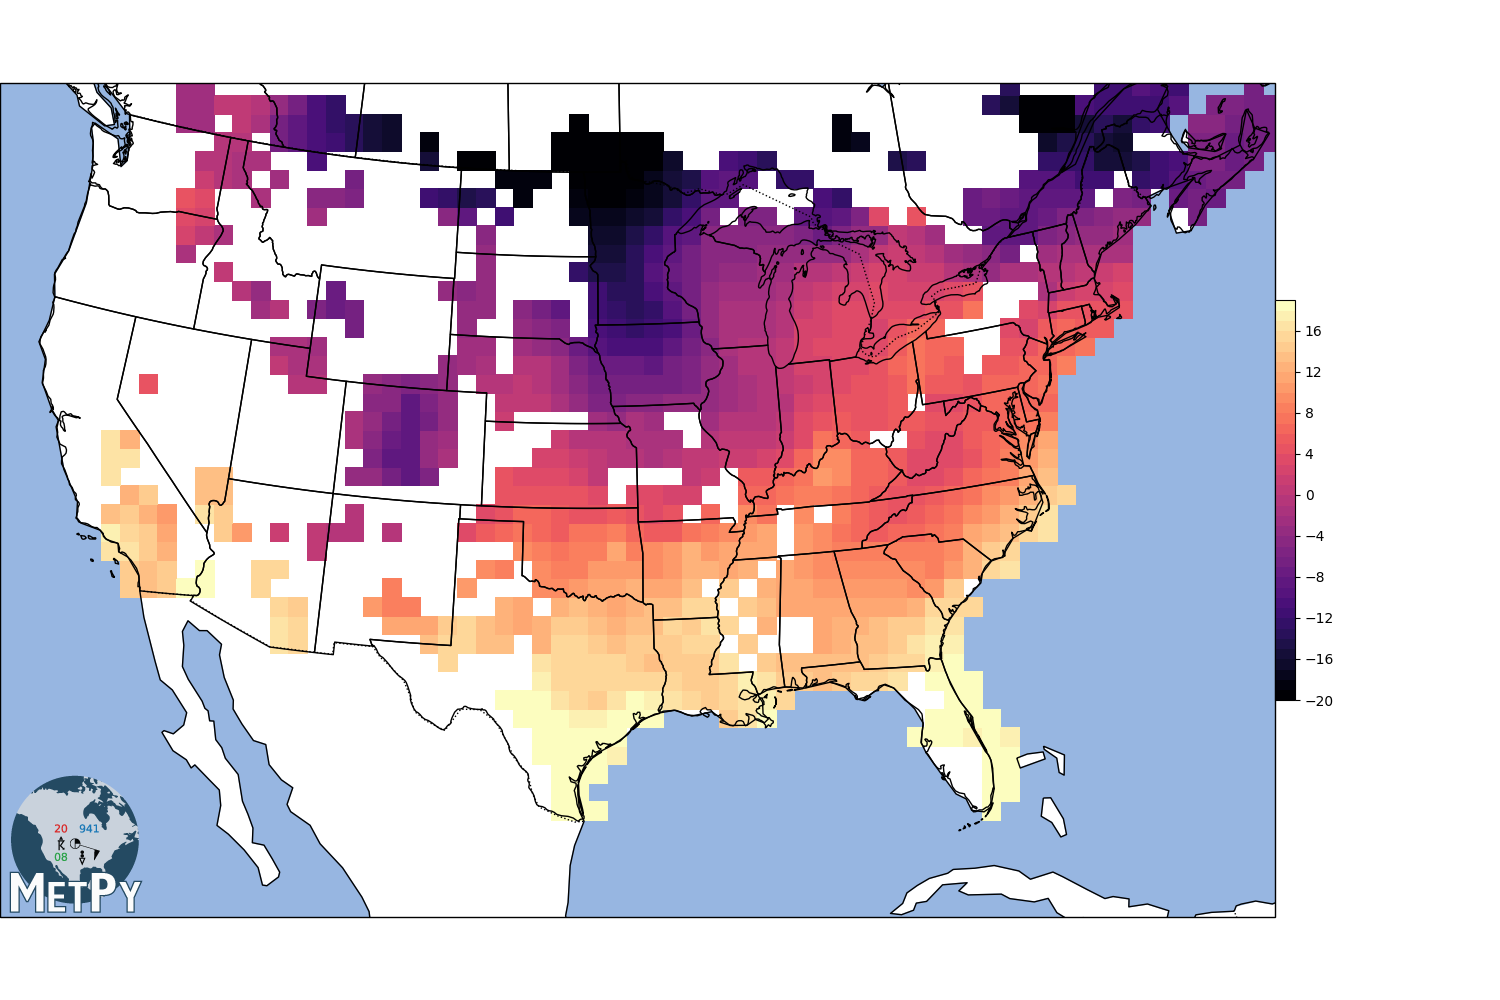
Barnes Interpolation
search_radius = 100km
min_neighbors = 3
gx, gy, img1 = interpolate_to_grid(x, y, temp, interp_type='barnes', hres=75000,
                                   search_radius=100000)
img1 = np.ma.masked_where(np.isnan(img1), img1)
fig, view = basic_map(to_proj)
mmb = view.pcolormesh(gx, gy, img1, cmap=cmap, norm=norm)
fig.colorbar(mmb, shrink=.4, pad=0, boundaries=levels)
Radial basis function interpolation
linear
gx, gy, img = interpolate_to_grid(x, y, temp, interp_type='rbf', hres=75000, rbf_func='linear',
                                  rbf_smooth=0)
img = np.ma.masked_where(np.isnan(img), img)
fig, view = basic_map(to_proj)
mmb = view.pcolormesh(gx, gy, img, cmap=cmap, norm=norm)
fig.colorbar(mmb, shrink=.4, pad=0, boundaries=levels)

plt.show()
Total running time of the script: ( 1 minutes 32.395 seconds)