Note
Click here to download the full example code
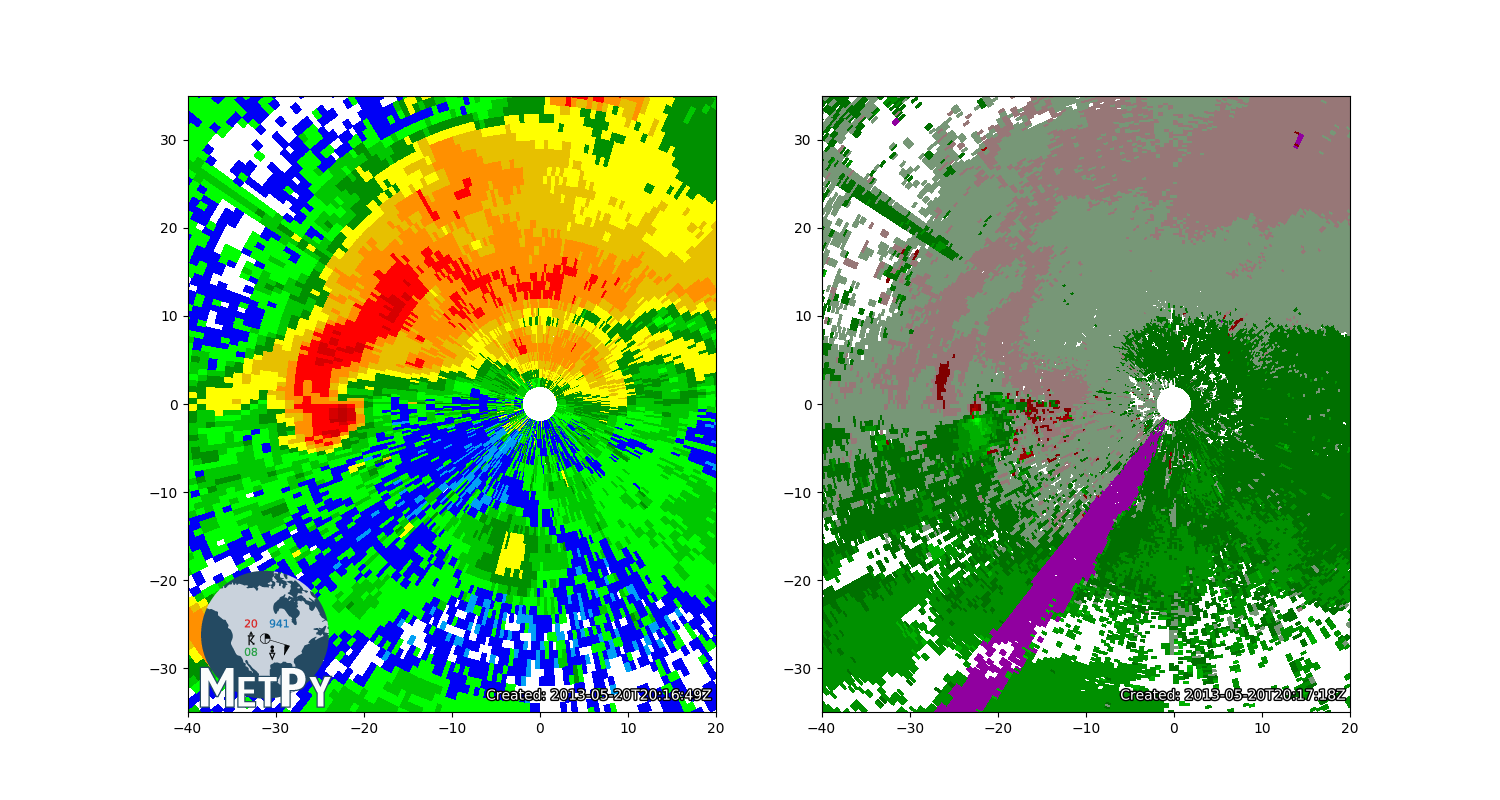
NEXRAD Level 3 File
Use MetPy to read information from a NEXRAD Level 3 (NIDS product) file and plot
import matplotlib.pyplot as plt
import numpy as np

from metpy.cbook import get_test_data
from metpy.io import Level3File
from metpy.plots import add_metpy_logo, add_timestamp, colortables
fig, axes = plt.subplots(1, 2, figsize=(15, 8))
add_metpy_logo(fig, 190, 85, size='large')
for v, ctable, ax in zip(('N0Q', 'N0U'), ('NWSReflectivity', 'NWSVelocity'), axes):
    # Open the file
    name = get_test_data('nids/KOUN_SDUS54_{}TLX_201305202016'.format(v), as_file_obj=False)
    f = Level3File(name)

    # Pull the data out of the file object
    datadict = f.sym_block[0][0]

    # Turn into an array, then mask
    data = np.ma.array(datadict['data'])
    data[data == 0] = np.ma.masked

    # Grab azimuths and calculate a range based on number of gates
    az = np.array(datadict['start_az'] + [datadict['end_az'][-1]])
    rng = np.linspace(0, f.max_range, data.shape[-1] + 1)

    # Convert az,range to x,y
    xlocs = rng * np.sin(np.deg2rad(az[:, np.newaxis]))
    ylocs = rng * np.cos(np.deg2rad(az[:, np.newaxis]))

    # Plot the data
    norm, cmap = colortables.get_with_steps(ctable, 16, 16)
    ax.pcolormesh(xlocs, ylocs, data, norm=norm, cmap=cmap)
    ax.set_aspect('equal', 'datalim')
    ax.set_xlim(-40, 20)
    ax.set_ylim(-30, 30)
    add_timestamp(ax, f.metadata['prod_time'], y=0.02, high_contrast=True)

plt.show()
Total running time of the script: ( 0 minutes 0.548 seconds)