Hodograph
-
class
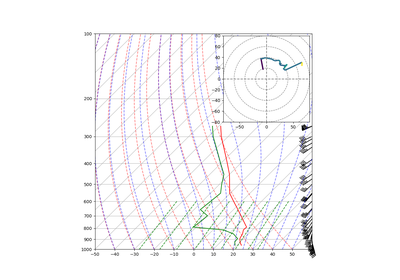
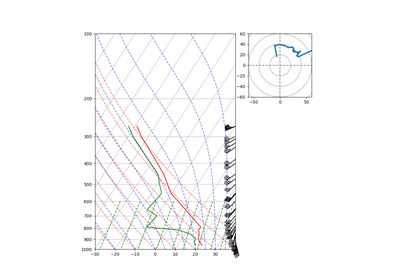
metpy.plots.Hodograph(ax=None, component_range=80)[source]¶ Make a hodograph of wind data.
Plots the u and v components of the wind along the x and y axes, respectively.
This class simplifies the process of creating a hodograph using matplotlib. It provides helpers for creating a circular grid and for plotting the wind as a line colored by another value (such as wind speed).
-
ax¶ matplotlib.axes.Axes– The underlying Axes instance used for all plotting
Create a Hodograph instance.
Parameters: - ax (
matplotlib.axes.Axes, optional) – The Axes instance used for plotting - component_range (value) – The maximum range of the plot. Used to set plot bounds and control the maximum number of grid rings needed.
Methods Summary
__init__([ax, component_range])Create a Hodograph instance. add_grid([increment])Add grid lines to hodograph. plot(u, v, **kwargs)Plot u, v data. plot_colormapped(u, v, c, **kwargs)Plot u, v data, with line colored based on a third set of data. Methods Documentation
-
__init__(ax=None, component_range=80)[source]¶ Create a Hodograph instance.
Parameters: - ax (
matplotlib.axes.Axes, optional) – The Axes instance used for plotting - component_range (value) – The maximum range of the plot. Used to set plot bounds and control the maximum number of grid rings needed.
- ax (
-
add_grid(increment=10.0, **kwargs)[source]¶ Add grid lines to hodograph.
Creates lines for the x- and y-axes, as well as circles denoting wind speed values.
Parameters: - increment (value, optional) – The value increment between rings
- kwargs – Other kwargs to control appearance of lines
-
plot(u, v, **kwargs)[source]¶ Plot u, v data.
Plots the wind data on the hodograph.
Parameters: - u (array_like) – u-component of wind
- v (array_like) – v-component of wind
- kwargs – Other keyword arguments to pass to
matplotlib.axes.Axes.plot()
Returns: list[matplotlib.lines.Line2D] – lines plotted
See also
-
plot_colormapped(u, v, c, **kwargs)[source]¶ Plot u, v data, with line colored based on a third set of data.
Plots the wind data on the hodograph, but with a colormapped line.
Simple wrapper around plot so that pressure is the first (independent) input. This is essentially a wrapper around semilogy. It also sets some appropriate ticking and plot ranges.
Parameters: - u (array_like) – u-component of wind
- v (array_like) – v-component of wind
- c (array_like) – data to use for colormapping
- kwargs – Other keyword arguments to pass to
matplotlib.collections.LineCollection
Returns: matplotlib.collections.LineCollection – instance created
See also
-