
Note
Go to the end to download the full example code.
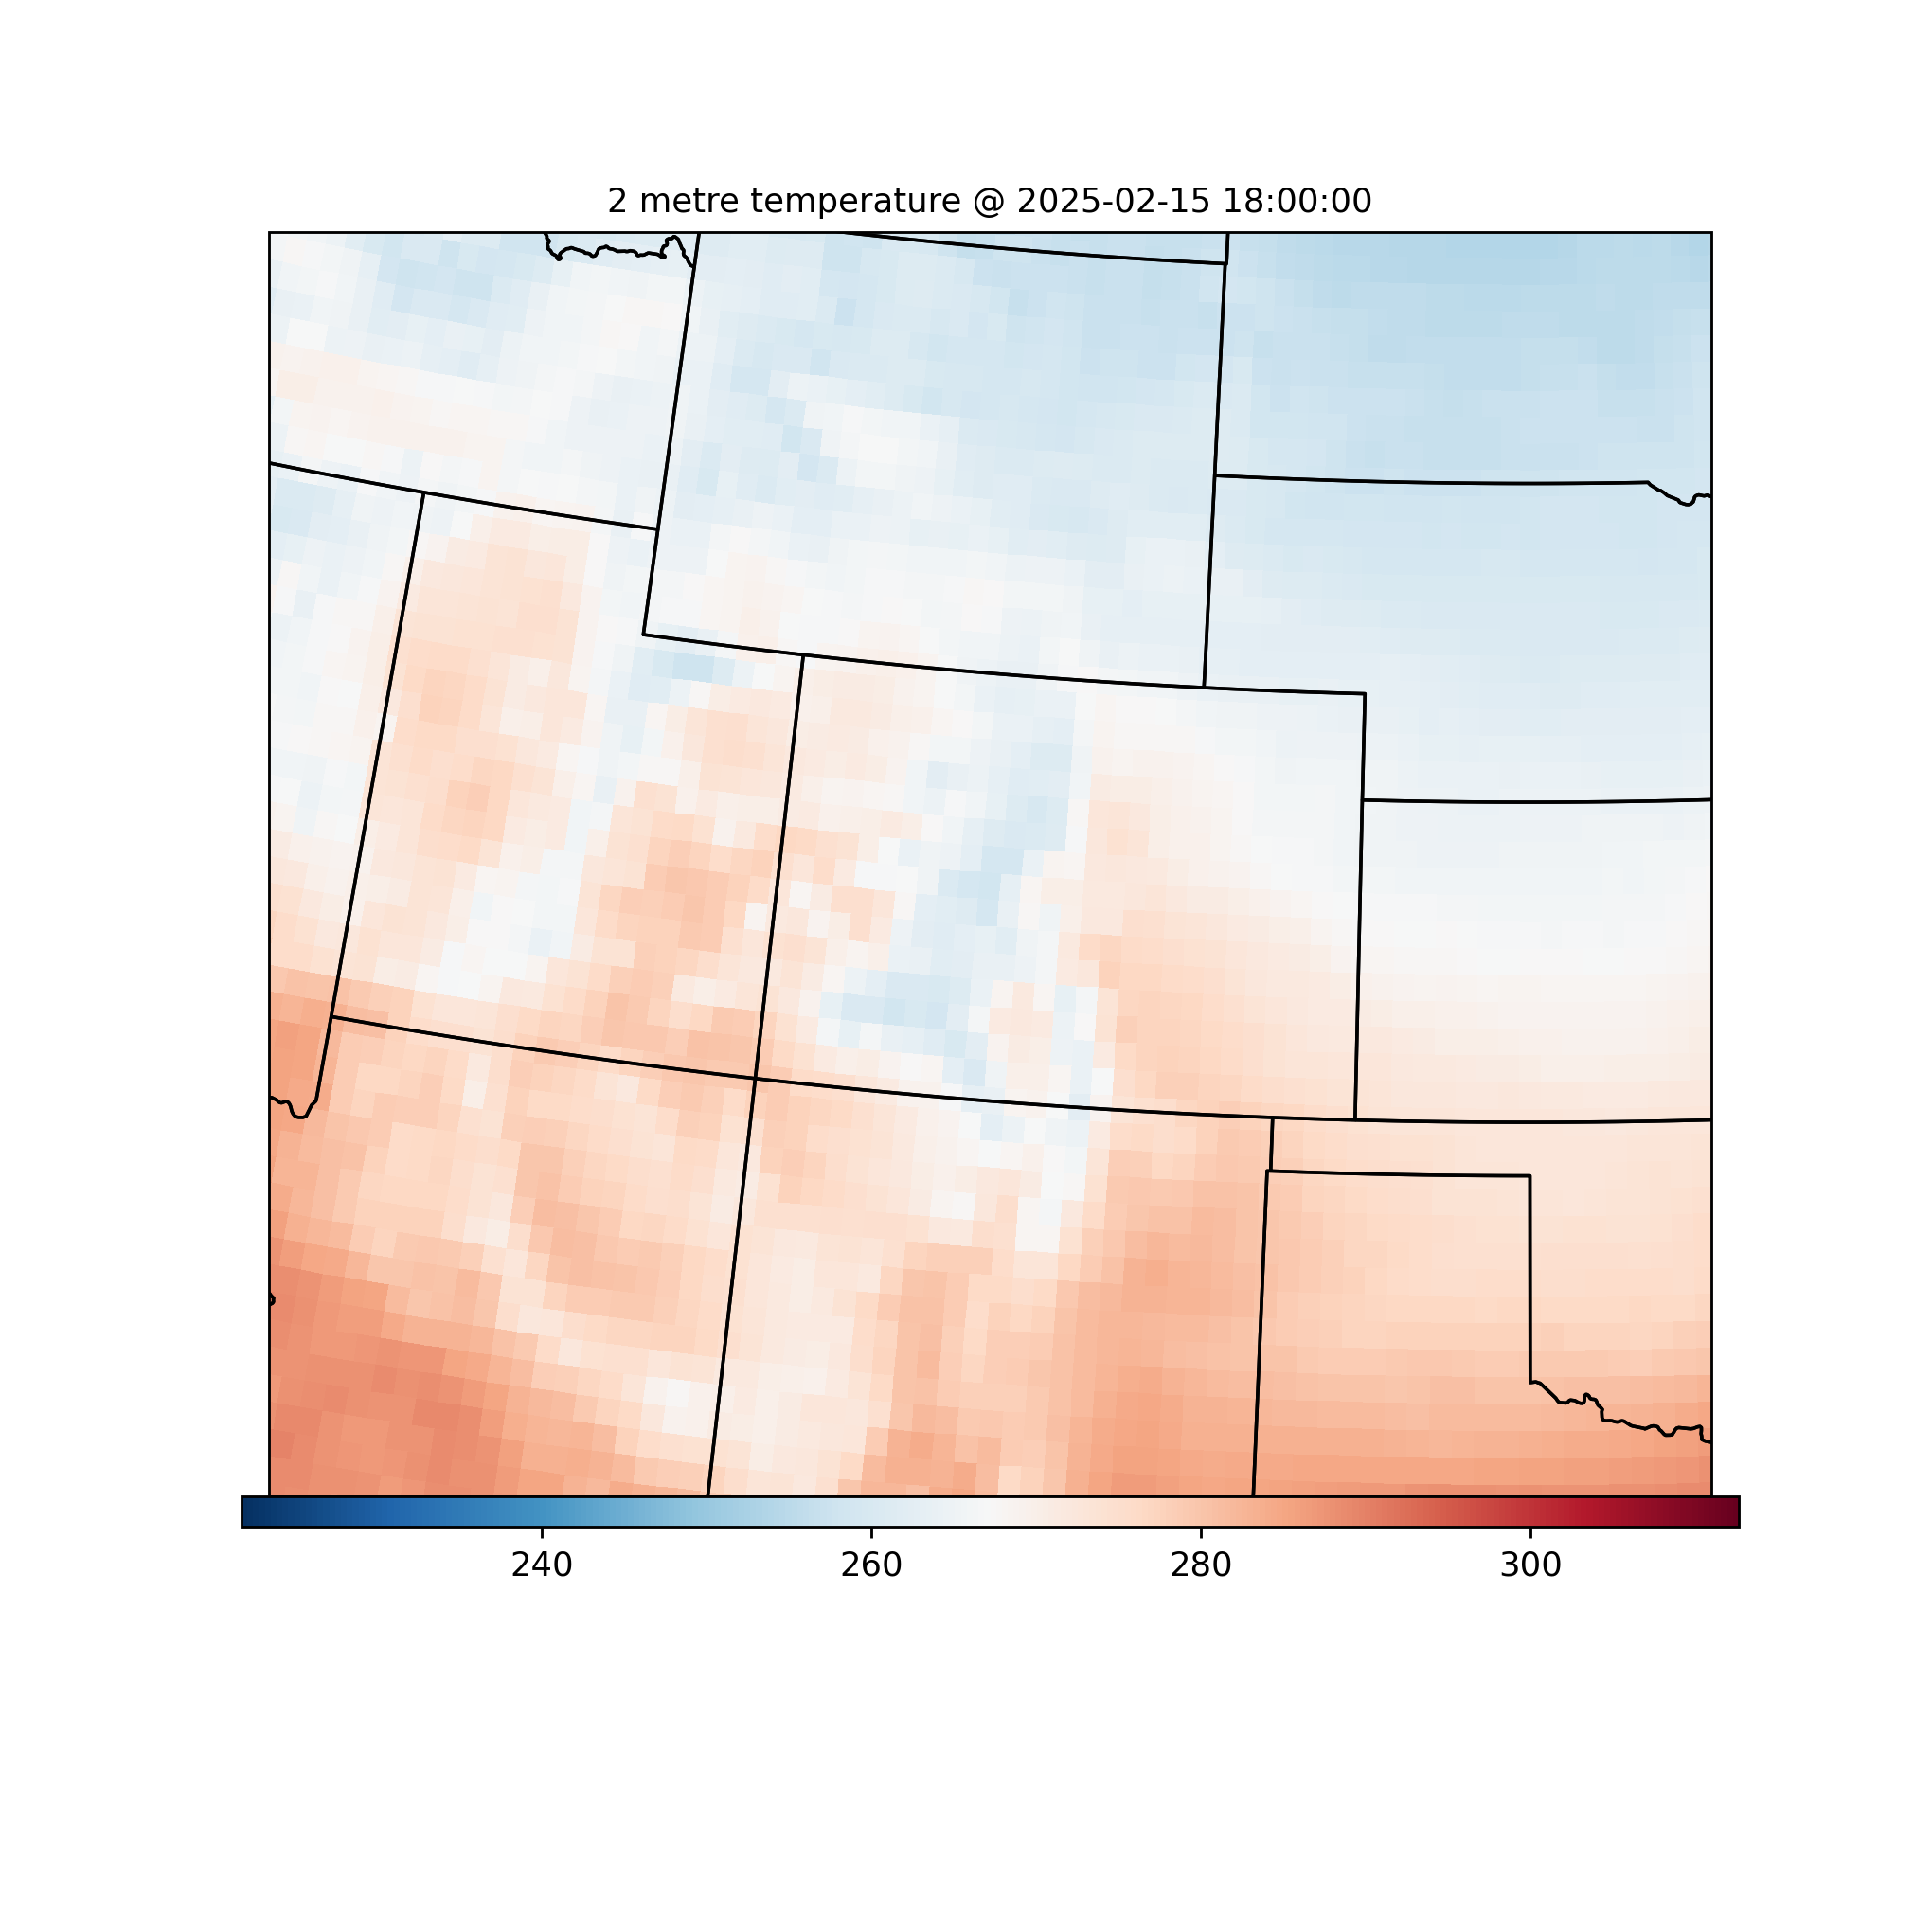
ML Weather Prediction Access and Plotting#
Use MetPy to access machine learning weather prediction (MLWP) data in AWS S3 and plot using the simplified plotting interface.
from datetime import datetime

from metpy.plots import MapPanel, PanelContainer, RasterPlot
from metpy.remote import MLWPArchive

###################
# Access the GraphCast forecast closest to the desired date/time
dt = datetime(2025, 2, 15, 18)
ds = MLWPArchive().get_product('graphcast', dt).access()

###################
# Plot the data using MetPy's simplified plotting interface.
raster = RasterPlot()
raster.data = ds
raster.field = 't2'
raster.time = dt
raster.colorbar = 'horizontal'
raster.colormap = 'RdBu_r'

panel = MapPanel()
panel.area = 'co'
panel.projection = 'lcc'
panel.layers = ['coastline', 'borders', 'states']
panel.plots = [raster]
panel.title = f"{ds[raster.field].attrs['long_name']} @ {dt}"

pc = PanelContainer()
pc.size = (8, 8)
pc.panels = [panel]
pc.draw()

pc.show()
Total running time of the script: (0 minutes 12.044 seconds)