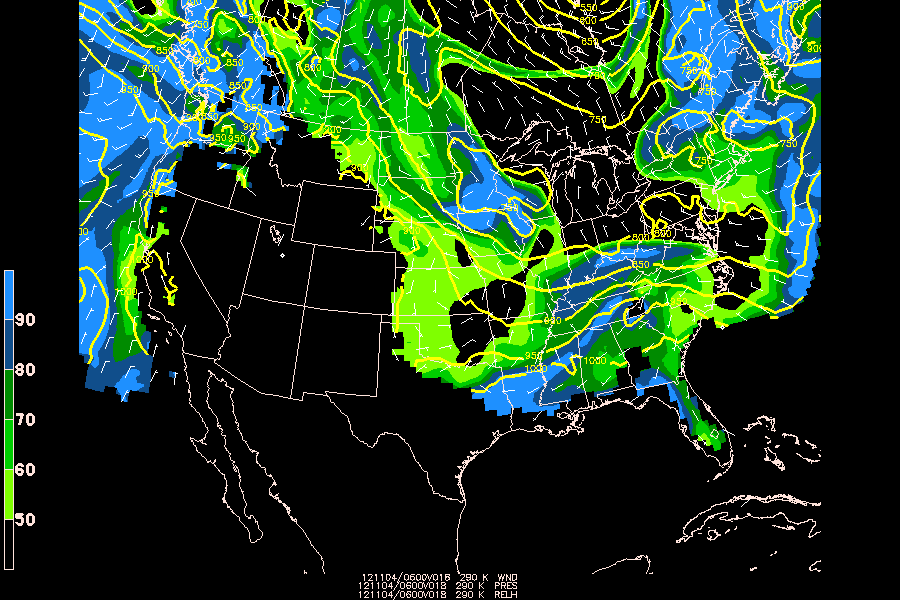
Isentropic ananlyses allow you to view vertical motion along a theta surface (dry adiabats) to asses vertical motion, and combined with relative humidity, may indicate convection or potential for convection.
First you must create a new grid file with gdcfil called thta.gem
GDOUTF   = thta.gem
PROJ     =
GRDAREA  = us
KXKY     =
MAXGRD   = 200
CPYFIL   = $MODEL/gfs/2012110312_gfs212.gem
ANLYSS   =
GEMPAK-GDCFIL>r
Next, interpolate the vertical levels from pressure to isentropic coordinates THTA with gdvint:
GDFILE   = $MODEL/gfs/2012110312_gfs212.gem
GDOUTF   = thta.gem
GDATTIM  = f018
GVCORD   = pres/thta
GLEVEL   = 280-320-10
MAXGRD   = 200
GAREA    = us
VCOORD   = pres
GEMPAK-GDVINT>r
Finally, plot variables on the 280 K theta surface with gdplot2:
GDFILE   = thta.gem
GDATTIM  = f018
GLEVEL   = 290
GVCORD   = thta
PANEL    = 0
SKIP     =
SCALE    = 0
GDPFUN   = relh         ! pres          ! wnd
TYPE     = f            ! c             ! B
CONTUR   = 1
CINT     =              ! 50
LINE     =              ! 5//3
FINT     = 10/50/90
FLINE    = 0;21-25-1
HILO     =
HLSYM    =
CLRBAR   = 1/V/ll
WIND     =              !               ! bk31/0.4
REFVEC   = 10
TITLE    = 1/-1         ! 1/-2          ! 1/-3
TEXT     = 0.65/2//hw
CLEAR    = n
GAREA    = us
IJSKIP   = 0            !               ! 3
PROJ     = str/90;-100;0
MAP      = 1
MSCALE   =
LATLON   = 0
DEVICE   = xw
STNPLT   =
SATFIL   =
RADFIL   =
IMCBAR   =
LUTFIL   =
STREAM   =
POSN     =
COLORS   =
MARKER   =
GRDLBL   =
FILTER   = no
GEMPAK-GDPLOT2>r
