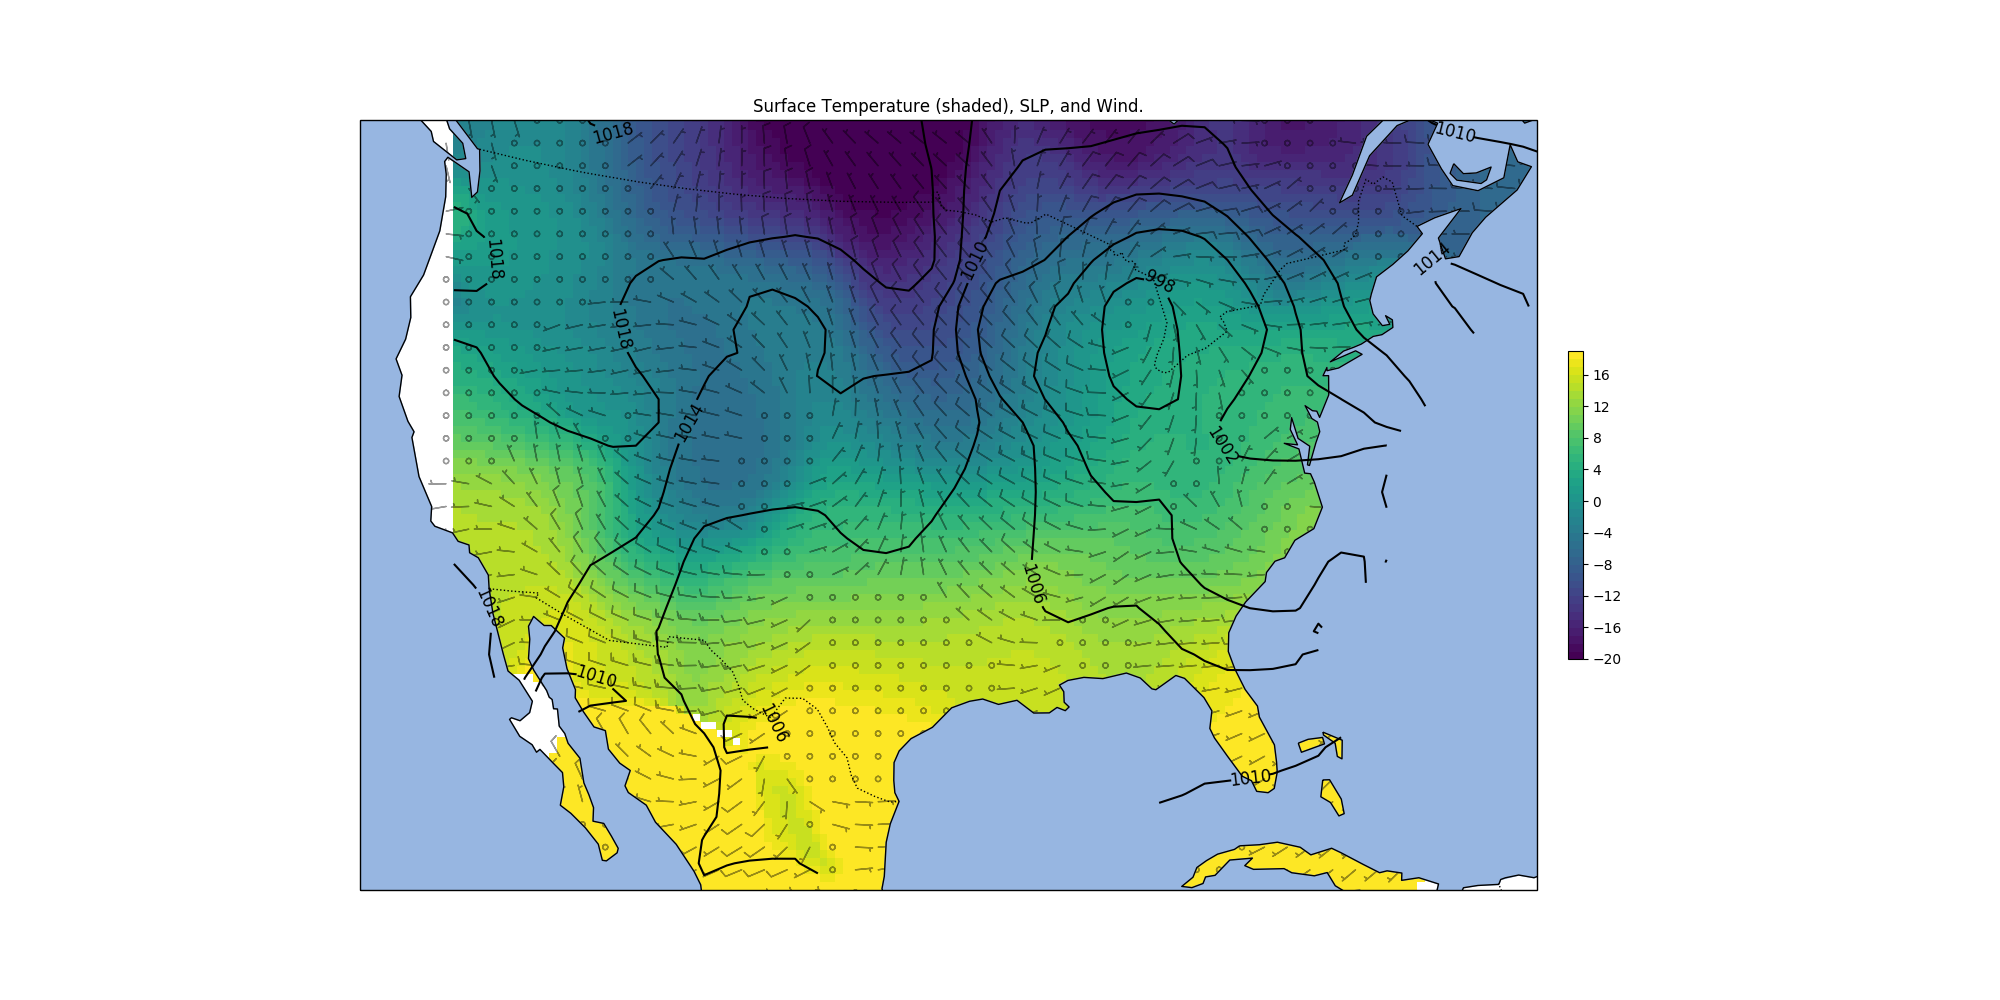
Wind and Sea Level Pressure Interpolation
Interpolate sea level pressure, as well as wind component data, to make a consistent looking analysis, featuring contours of pressure and wind barbs.
import cartopy
import cartopy.crs as ccrs
from matplotlib.colors import BoundaryNorm
import matplotlib.pyplot as plt
import numpy as np

from metpy.calc import get_wind_components
from metpy.cbook import get_test_data
from metpy.gridding.gridding_functions import interpolate, remove_nan_observations
from metpy.units import units

from_proj = ccrs.Geodetic()
to_proj = ccrs.AlbersEqualArea(central_longitude=-97., central_latitude=38.)


def station_test_data(variable_names, proj_from=None, proj_to=None):
    f = get_test_data('station_data.txt')

    all_data = np.loadtxt(f, skiprows=1, delimiter=',',
                          usecols=(1, 2, 3, 4, 5, 6, 7, 17, 18, 19),
                          dtype=np.dtype([('stid', '3S'), ('lat', 'f'), ('lon', 'f'),
                                          ('slp', 'f'), ('air_temperature', 'f'),
                                          ('cloud_fraction', 'f'), ('dewpoint', 'f'),
                                          ('weather', '16S'),
                                          ('wind_dir', 'f'), ('wind_speed', 'f')]))

    all_stids = [s.decode('ascii') for s in all_data['stid']]
    data = np.concatenate([all_data[all_stids.index(site)].reshape(1, ) for site in all_stids])

    value = data[variable_names]
    lon = data['lon']
    lat = data['lat']

    if proj_from is not None and proj_to is not None:
            proj_points = proj_to.transform_points(proj_from, lon, lat)
            return proj_points[:, 0], proj_points[:, 1], value

    return lon, lat, value
Get pressure information using the sample station data
xp, yp, pres = station_test_data(['slp'], from_proj, to_proj)
Remove all missing data from pressure
pres = np.array([p[0] for p in pres])

xp, yp, pres = remove_nan_observations(xp, yp, pres)
Interpolate pressure as usual
slpgridx, slpgridy, slp = interpolate(xp, yp, pres, interp_type='cressman',
                                      minimum_neighbors=1, search_radius=400000, hres=100000)
Get wind information
x, y, wind = station_test_data(['wind_speed', 'wind_dir'], from_proj, to_proj)
Remove bad data from wind information
Calculate u and v components of wind and then interpolate both.
Both will have the same underlying grid so throw away grid returned from v interpolation.
u, v = get_wind_components((wind_speed * units('m/s')).to('knots'),
                           wind_dir * units.degree)

windgridx, windgridy, uwind = interpolate(x, y, np.array(u), interp_type='cressman',
                                          search_radius=400000, hres=100000)

_, _, vwind = interpolate(x, y, np.array(v), interp_type='cressman', search_radius=400000,
                          hres=100000)
Get temperature information
levels = list(range(-20, 20, 1))
cmap = plt.get_cmap('viridis')
norm = BoundaryNorm(levels, ncolors=cmap.N, clip=True)

xt, yt, t = station_test_data('air_temperature', from_proj, to_proj)
xt, yt, t = remove_nan_observations(xt, yt, t)

tempx, tempy, temp = interpolate(xt, yt, t, interp_type='cressman', minimum_neighbors=3,
                                 search_radius=400000, hres=35000)

temp = np.ma.masked_where(np.isnan(temp), temp)
Set up the map and plot the interpolated grids appropriately.
fig = plt.figure(figsize=(20, 10))
view = fig.add_subplot(1, 1, 1, projection=to_proj)

view.set_extent([-120, -70, 20, 50])
view.add_feature(cartopy.feature.NaturalEarthFeature(category='cultural',
                                                     name='admin_1_states_provinces_lakes',
                                                     scale='50m', facecolor='none'))
view.add_feature(cartopy.feature.OCEAN)
view.add_feature(cartopy.feature.COASTLINE)
view.add_feature(cartopy.feature.BORDERS, linestyle=':')

cs = view.contour(slpgridx, slpgridy, slp, colors='k', levels=list(range(990, 1034, 4)))
plt.clabel(cs, inline=1, fontsize=12, fmt='%i')

mmb = view.pcolormesh(tempx, tempy, temp, cmap=cmap, norm=norm)
plt.colorbar(mmb, shrink=.4, pad=0.02, boundaries=levels)

view.barbs(windgridx, windgridy, uwind, vwind, alpha=.4, length=5)

plt.title('Surface Temperature (shaded), SLP, and Wind.')

plt.show()
Total running time of the script: ( 0 minutes 3.367 seconds)