Advanced Sounding
Plot a sounding using MetPy with more advanced features.
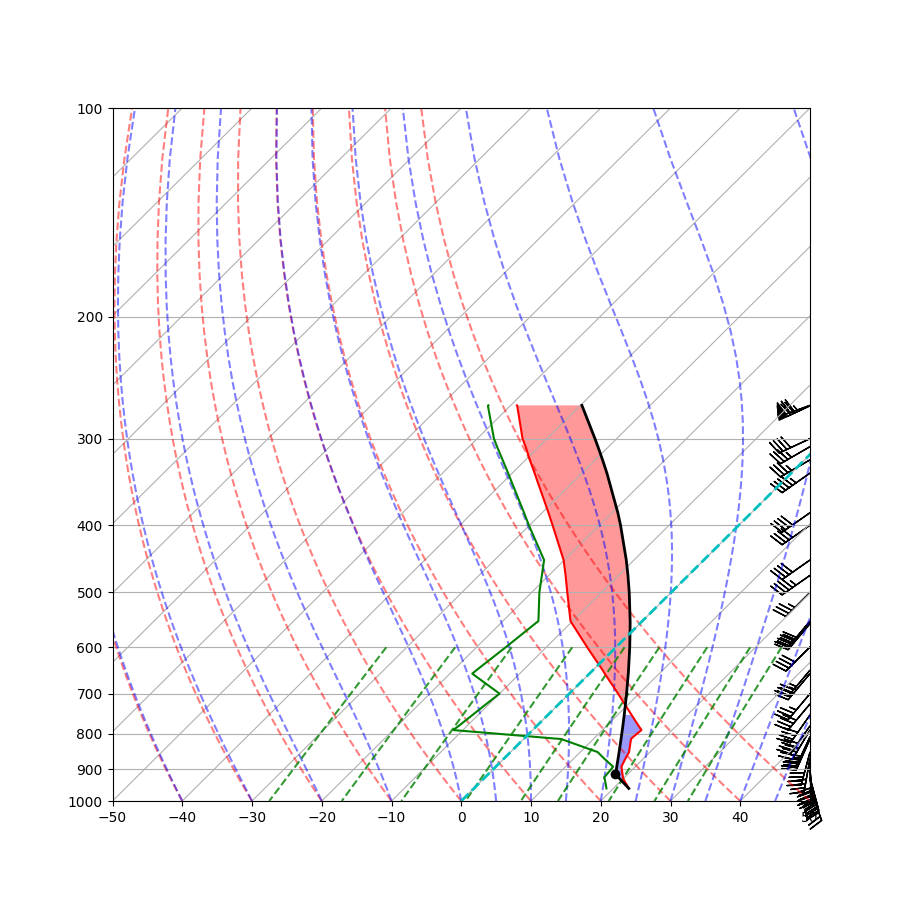
Beyond just plotting data, this uses calculations from metpy.calc to find the lifted condensation level (LCL) and the profile of a surface-based parcel. The area between the ambient profile and the parcel profile is colored as well.
from datetime import datetime

import matplotlib.pyplot as plt

import metpy.calc as mpcalc
from metpy.io import get_upper_air_data
from metpy.io.upperair import UseSampleData
from metpy.plots import SkewT
from metpy.units import concatenate
with UseSampleData():  # Only needed to use our local sample data
    # Download and parse the data
    dataset = get_upper_air_data(datetime(1999, 5, 4, 0), 'OUN')

p = dataset.variables['pressure'][:]
T = dataset.variables['temperature'][:]
Td = dataset.variables['dewpoint'][:]
u = dataset.variables['u_wind'][:]
v = dataset.variables['v_wind'][:]
Create a new figure. The dimensions here give a good aspect ratio
fig = plt.figure(figsize=(9, 9))
skew = SkewT(fig, rotation=45)

# Plot the data using normal plotting functions, in this case using
# log scaling in Y, as dictated by the typical meteorological plot
skew.plot(p, T, 'r')
skew.plot(p, Td, 'g')
skew.plot_barbs(p, u, v)
skew.ax.set_ylim(1000, 100)
skew.ax.set_xlim(-40, 60)

# Calculate LCL height and plot as black dot
l = mpcalc.lcl(p[0], T[0], Td[0])
lcl_temp = mpcalc.dry_lapse(concatenate((p[0], l)), T[0])[-1].to('degC')
skew.plot(l, lcl_temp, 'ko', markerfacecolor='black')

# Calculate full parcel profile and add to plot as black line
prof = mpcalc.parcel_profile(p, T[0], Td[0]).to('degC')
skew.plot(p, prof, 'k', linewidth=2)

# Example of coloring area between profiles
greater = T >= prof
skew.ax.fill_betweenx(p, T, prof, where=greater, facecolor='blue', alpha=0.4)
skew.ax.fill_betweenx(p, T, prof, where=~greater, facecolor='red', alpha=0.4)

# An example of a slanted line at constant T -- in this case the 0
# isotherm
l = skew.ax.axvline(0, color='c', linestyle='--', linewidth=2)

# Add the relevant special lines
skew.plot_dry_adiabats()
skew.plot_moist_adiabats()
skew.plot_mixing_lines()

# Show the plot
plt.show()
Total running time of the script: ( 0 minutes 0.631 seconds)