Note
Click here to download the full example code
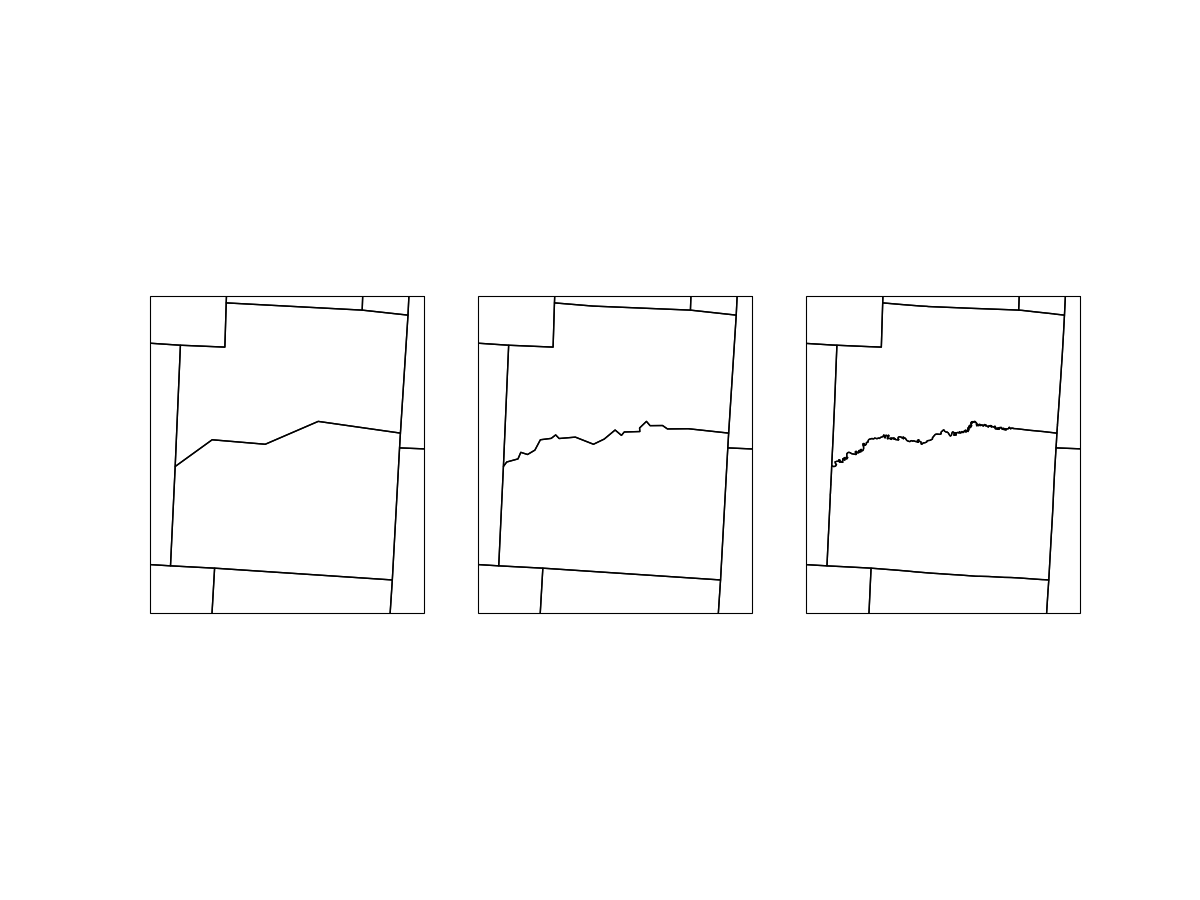
US Counties
Demonstrate how to plot US counties at all three available resolutions.
import cartopy.crs as ccrs
import matplotlib.pyplot as plt

from metpy.plots import USCOUNTIES
proj = ccrs.LambertConformal(central_longitude=-85.0, central_latitude=45.0)

fig = plt.figure(figsize=(12, 9))
ax1 = fig.add_subplot(1, 3, 1, projection=proj)
ax2 = fig.add_subplot(1, 3, 2, projection=proj)
ax3 = fig.add_subplot(1, 3, 3, projection=proj)

for scale, axis in zip(['20m', '5m', '500k'], [ax1, ax2, ax3]):
    axis.set_extent([270.25, 270.9, 38.15, 38.75], ccrs.Geodetic())
    axis.add_feature(USCOUNTIES.with_scale(scale))

Total running time of the script: ( 0 minutes 1.199 seconds)