MetPy
  • Installation Guide
  • Getting Started with MetPy
  • Unit Support
  • Examples
  • Python Gallery (separate site)
  • Tutorials
  • Reference Guide
    • constants
    • units
    • io
    • calc
    • plots
      • add_metpy_logo
        • Examples using metpy.plots.add_metpy_logo
      • add_timestamp
      • add_unidata_logo
      • convert_gempak_color
      • read_colortable
      • wx_code_to_numeric
      • BarbPlot
      • ContourPlot
      • FilledContourPlot
      • Hodograph
      • ImagePlot
      • MapPanel
      • PanelContainer
      • PlotObs
      • PlotScalar
      • PlotVector
      • Plots2D
      • SkewT
      • StationPlot
      • StationPlotLayout
    • ctables
    • interpolate
    • xarray
  • MetPy Roadmap
  • GEMPAK Conversion Guide
  • Support
  • Contributors Guide
  • Infrastructure Guide
  • Citing MetPy
  • References
MetPy
  • Docs »
  • Reference Guide »
  • plots »
  • add_metpy_logo
  • Improve this page

add_metpy_logo

metpy.plots.add_metpy_logo(fig, x=10, y=25, zorder=100, size='small', **kwargs)[source]

Add the MetPy logo to a figure.

Adds an image of the MetPy logo to the figure.

Parameters
  • fig (matplotlib.figure) – The figure instance used for plotting

  • x (int) – x position padding in pixels

  • y (float) – y position padding in pixels

  • zorder (int) – The zorder of the logo

  • size (str) – Size of logo to be used. Can be ‘small’ for 75 px square or ‘large’ for 150 px square.

Returns

matplotlib.image.FigureImage – The matplotlib.image.FigureImage instance created

Examples using metpy.plots.add_metpy_logo

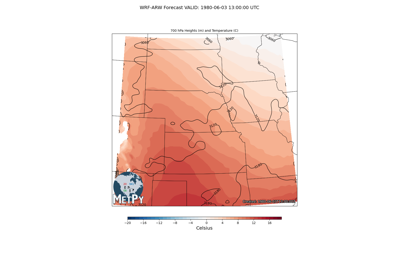
Sigma to Pressure Interpolation

Sigma to Pressure Interpolation

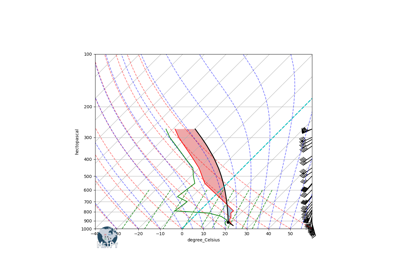
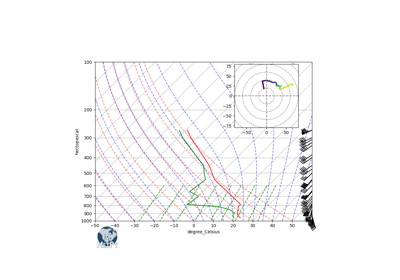
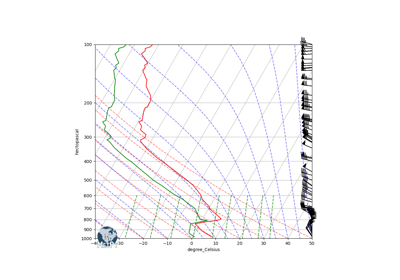
Advanced Sounding

Advanced Sounding

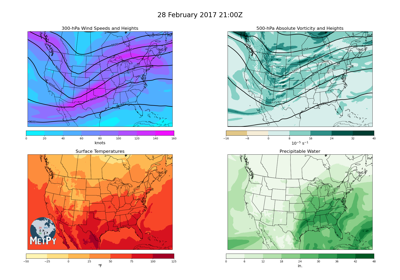
Four Panel Map

Four Panel Map

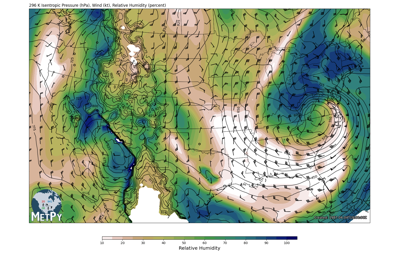
Isentropic Analysis

Isentropic Analysis

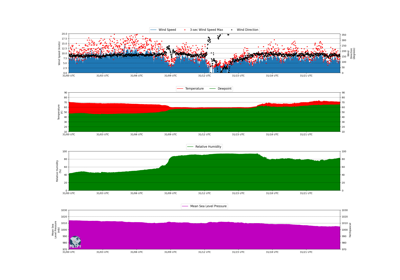
Meteogram

Meteogram

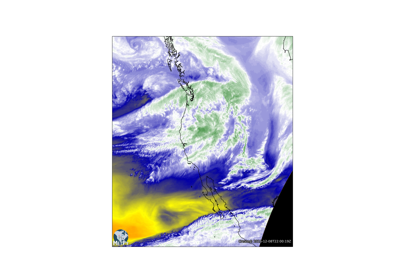
GINI Water Vapor Imagery

GINI Water Vapor Imagery

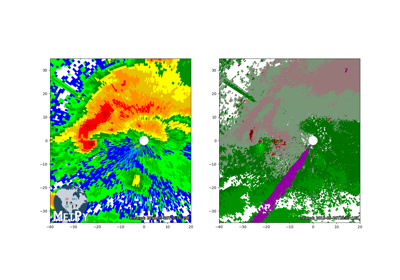
NEXRAD Level 3 File

NEXRAD Level 3 File

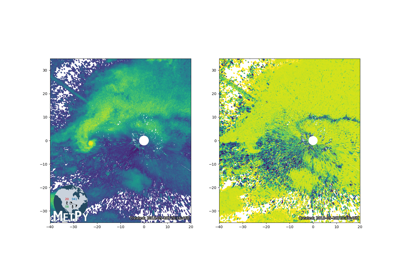
NEXRAD Level 2 File

NEXRAD Level 2 File

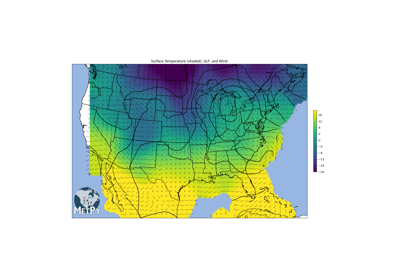
Wind and Sea Level Pressure Interpolation

Wind and Sea Level Pressure Interpolation

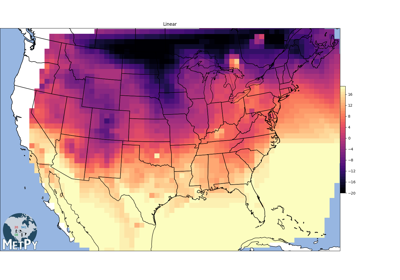
Point Interpolation

Point Interpolation

Skew-T with Complex Layout

Skew-T with Complex Layout

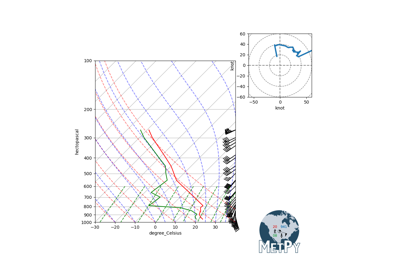
Hodograph Inset

Hodograph Inset

Simple Sounding

Simple Sounding

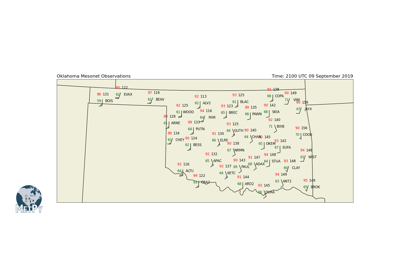
Mesonet Station Plot

Mesonet Station Plot

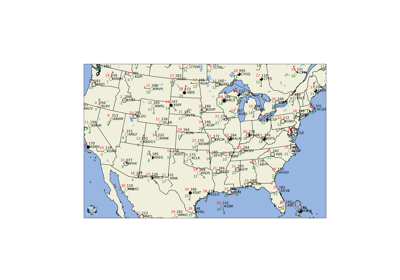
Station Plot

Station Plot

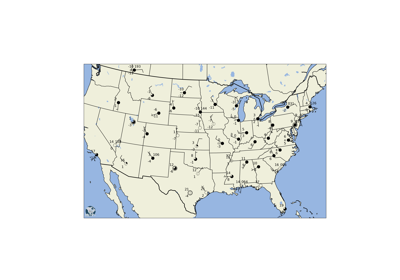
Station Plot with Layout

Station Plot with Layout

Next Previous

© Copyright 2019, MetPy Developers. Development supported by National Science Foundation grants AGS-1344155, OAC-1740315, and AGS-1901712.. Last updated on Aug 06, 2020 at 20:22:57.

Built with Sphinx using a theme provided by Read the Docs.