Note
Click here to download the full example code
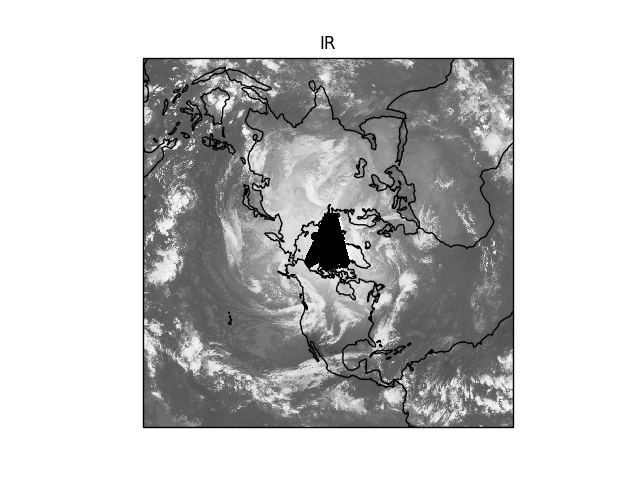
Simple Plotting
Demonstrate the use of MetPy’s simplified plotting interface.
Plots a sample satellite image file.
Out:
/home/travis/virtualenv/python3.6.7/lib/python3.6/site-packages/pooch/core.py:352: UserWarning: Downloading data file 'NHEM-MULTICOMP_1km_IR_20151208_2100.gini' from remote data store 'https://github.com/Unidata/MetPy/raw/v0.10.2/staticdata/NHEM-MULTICOMP_1km_IR_20151208_2100.gini' to '/home/travis/build/Unidata/MetPy/staticdata/v0.10.2'.
  action_word[action], fname, self.get_url(fname), str(self.path)
Adjusting bad PDB size from 0 to 512.
import xarray as xr

from metpy.cbook import get_test_data
from metpy.io import GiniFile
from metpy.plots import ImagePlot, MapPanel, PanelContainer

data = xr.open_dataset(GiniFile(get_test_data('NHEM-MULTICOMP_1km_IR_20151208_2100.gini')))

img = ImagePlot()
img.data = data
img.field = 'IR'
img.colormap = 'Greys_r'

panel = MapPanel()
panel.plots = [img]

pc = PanelContainer()
pc.panels = [panel]
pc.show()
Total running time of the script: ( 0 minutes 1.215 seconds)