%matplotlib inline# Copyright (c) 2019 MetPy Developers.
# Distributed under the terms of the BSD 3-Clause License.
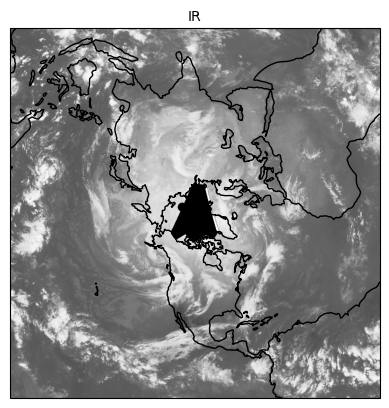
# SPDX-License-Identifier: BSD-3-ClauseSimple Plotting
Demonstrate the use of MetPy’s simplified plotting interface.
Plots a sample satellite image file.
import xarray as xr

from metpy.cbook import get_test_data
from metpy.plots import ImagePlot, MapPanel, PanelContainer

data = xr.open_dataset(get_test_data('NHEM-MULTICOMP_1km_IR_20151208_2100.gini',
                                     as_file_obj=False))

img = ImagePlot()
img.data = data
img.field = 'IR'
img.colormap = 'Greys_r'

panel = MapPanel()
panel.plots = [img]

pc = PanelContainer()
pc.panels = [panel]
pc.show()
Adjusting bad PDB size from 0 to 512.