%matplotlib inline# Copyright (c) 2021 MetPy Developers.
# Distributed under the terms of the BSD 3-Clause License.
# SPDX-License-Identifier: BSD-3-ClauseRaster Plots using Declarative Syntax
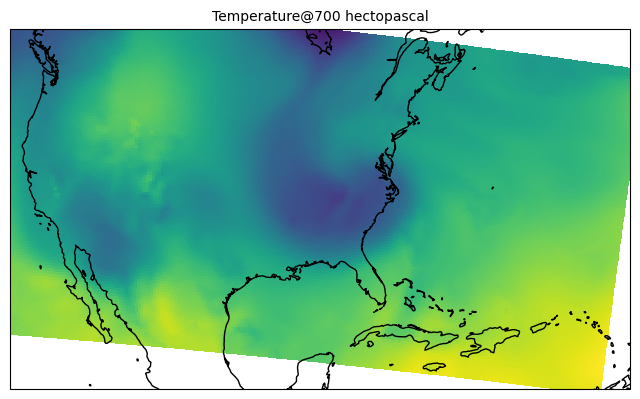
The MetPy declarative syntax allows for a simplified interface to creating common meteorological analyses including surface observation plots. This example creates a temperature raster plot, though other potential raster plots include radar.
import xarray as xr

from metpy.cbook import get_test_data
from metpy.plots import MapPanel, PanelContainer, RasterPlot
from metpy.units import units
Import the temperature data from the NARR file.
narr_data = xr.open_dataset(get_test_data('narr_example.nc', as_file_obj=False))Preview the data:
narr_dataLoading...
Create the ‘RasterPlot’ object and provide it with the NARR data. Specify the level to be plotted, and use the Data variables column to specify the data field to be plotted.
raster = RasterPlot()
raster.data = narr_data
raster.field = 'Temperature'
raster.level = 700 * units.hPa
Add the plot to a Map Panel and Panel Container.
panel = MapPanel()
panel.area = 'us'
panel.projection = 'lcc'
panel.layers = ['coastline']
panel.plots = [raster]

pc = PanelContainer()
pc.size = (8, 8)
pc.panels = [panel]
pc.draw()

pc.show()