%matplotlib inline# Copyright (c) 2025 MetPy Developers.
# Distributed under the terms of the BSD 3-Clause License.
# SPDX-License-Identifier: BSD-3-ClauseML Weather Prediction Access and Plotting
Use MetPy to access machine learning weather prediction (MLWP) data in AWS S3 and plot using the simplified plotting interface.
from datetime import datetime
from metpy.plots import MapPanel, PanelContainer, RasterPlot
from metpy.remote import MLWPArchive
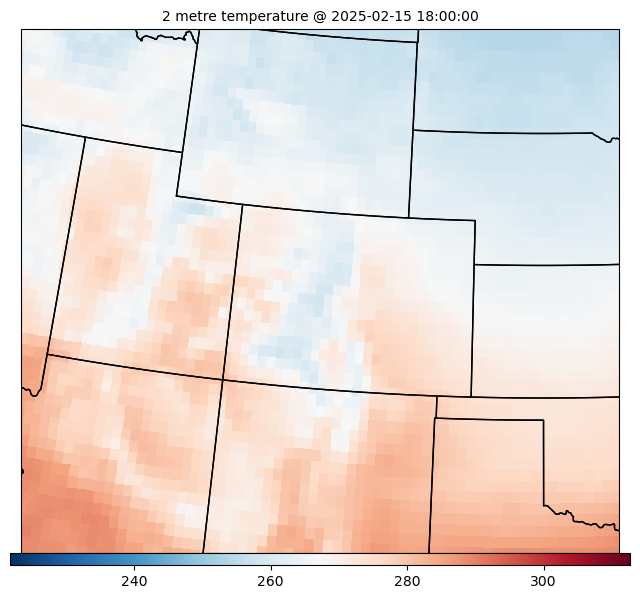
###################
# Access the GraphCast forecast closest to the desired date/time
dt = datetime(2025, 2, 15, 18)
ds = MLWPArchive().get_product('graphcast', dt).access()
###################
# Plot the data using MetPy's simplified plotting interface.
raster = RasterPlot()
raster.data = ds
raster.field = 't2'
raster.time = dt
raster.colorbar = 'horizontal'
raster.colormap = 'RdBu_r'
panel = MapPanel()
panel.area = 'co'
panel.projection = 'lcc'
panel.layers = ['coastline', 'borders', 'states']
panel.plots = [raster]
panel.title = f"{ds[raster.field].attrs['long_name']} @ {dt}"
pc = PanelContainer()
pc.size = (8, 8)
pc.panels = [panel]
pc.draw()
pc.show()