%matplotlib inline# Copyright (c) 2025 MetPy Developers.
# Distributed under the terms of the BSD 3-Clause License.
# SPDX-License-Identifier: BSD-3-ClauseHigh/Low Analysis
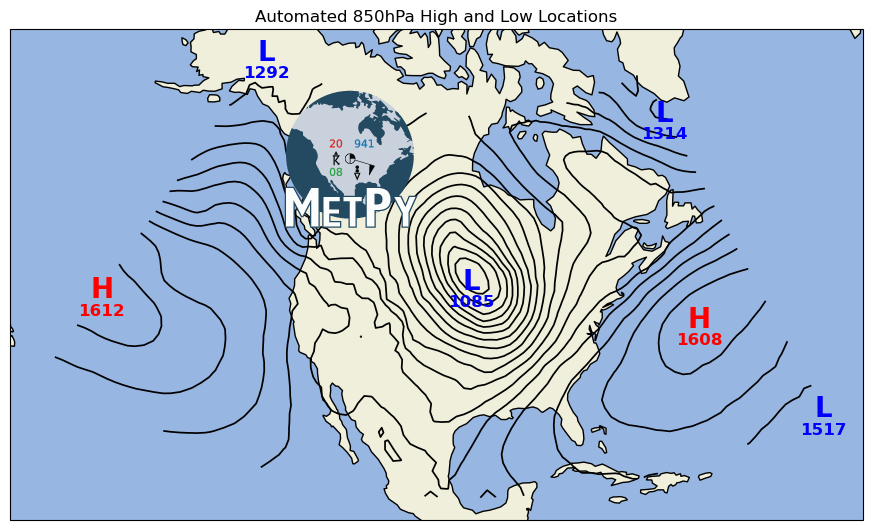
This uses MetPy’s find_peaks function to automatically identify locations of high and low
centers, and then plots them on a map.
import cartopy.crs as ccrs
import cartopy.feature as cfeature
import matplotlib.pyplot as plt
import xarray as xr

from metpy.calc import find_peaks
from metpy.cbook import get_test_data
from metpy.plots import add_metpy_logo, scattertext
from metpy.units import units
Start by loading some data from our sample GFS model dataset. Pull out the geopotential heights field for the 850 hPa layer, as well as grab the projection metadata.
data = xr.open_dataset(get_test_data('GFS_test.nc', as_file_obj=False)).metpy.parse_cf()
mslp = data.Geopotential_height_isobaric.metpy.sel(vertical=850 * units.hPa).squeeze()
dataproj = mslp.metpy.cartopy_crs
Here we use find_peaks to find the locations of the highs and then the lows
h_y, h_x = find_peaks(mslp.values)
l_y, l_x = find_peaks(mslp.values, maxima=False)
Plot the analyzed locations on top of the contours of height on a map
fig = plt.figure(figsize=(11., 8.))
ax = fig.add_subplot(1, 1, 1, projection=ccrs.LambertConformal(central_longitude=-95))
ax.contour(mslp.metpy.x, mslp.metpy.y, mslp, range(0, 2000, 30),
           colors='k', linewidths=1.25, linestyles='solid', transform=dataproj)

# Using scattertext() plot the high centers using a red 'H' and put the height value
# below the 'H' using a smaller font.
scattertext(ax, mslp.metpy.x[h_x], mslp.metpy.y[h_y], 'H', size=20, color='red',
            fontweight='bold', transform=dataproj)
scattertext(ax, mslp.metpy.x[h_x], mslp.metpy.y[h_y], mslp.values[h_y, h_x], formatter='.0f',
            size=12, color='red', loc=(0, -15), fontweight='bold', transform=dataproj)

# Now do the same for the lows using a blue 'L'
scattertext(ax, mslp.metpy.x[l_x], mslp.metpy.y[l_y], 'L', size=20, color='blue',
            fontweight='bold', transform=dataproj)
scattertext(ax, mslp.metpy.x[l_x], mslp.metpy.y[l_y], mslp.values[l_y, l_x], formatter='.0f',
            size=12, color='blue', loc=(0, -15), fontweight='bold', transform=dataproj)

ax.add_feature(cfeature.OCEAN)
ax.add_feature(cfeature.LAND)
ax.add_feature(cfeature.COASTLINE)

ax.set_title('Automated 850hPa High and Low Locations')
add_metpy_logo(fig, 275, 295, size='large')
plt.show()