%matplotlib inline# Copyright (c) 2022 MetPy Developers.
# Distributed under the terms of the BSD 3-Clause License.
# SPDX-License-Identifier: BSD-3-ClauseDivergence
Use metpy.calc.divergence.
This example demonstrates the calculation of total deformation using the example xarray Dataset and plotting using Matplotlib.
import matplotlib.pyplot as plt
import metpy.calc as mpcalc
from metpy.cbook import example_data
# load example data
ds = example_data()
# Calculate the total deformation of the flow
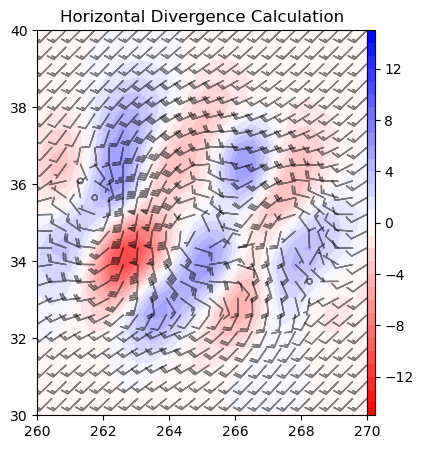
div = mpcalc.divergence(ds.uwind, ds.vwind)
# start figure and set axis
fig, ax = plt.subplots(figsize=(5, 5))
# plot divergence and scale by 1e5
cf = ax.contourf(ds.lon, ds.lat, div * 1e5, range(-15, 16, 1), cmap=plt.cm.bwr_r)
plt.colorbar(cf, pad=0, aspect=50)
ax.barbs(ds.lon.values, ds.lat.values, ds.uwind, ds.vwind, color='black', length=5, alpha=0.5)
ax.set(xlim=(260, 270), ylim=(30, 40))
ax.set_title('Horizontal Divergence Calculation')
plt.show()