%matplotlib inline# Copyright (c) 2019 MetPy Developers.
# Distributed under the terms of the BSD 3-Clause License.
# SPDX-License-Identifier: BSD-3-ClauseCombined Plotting
Demonstrate the use of MetPy’s simplified plotting interface combining multiple plots.
Also shows how to control the maps that are plotted. Plots sample NARR data.
import xarray as xr
from metpy.cbook import get_test_data
from metpy.plots import ContourPlot, ImagePlot, MapPanel, PanelContainer
from metpy.units import units
# Use sample NARR data for plotting
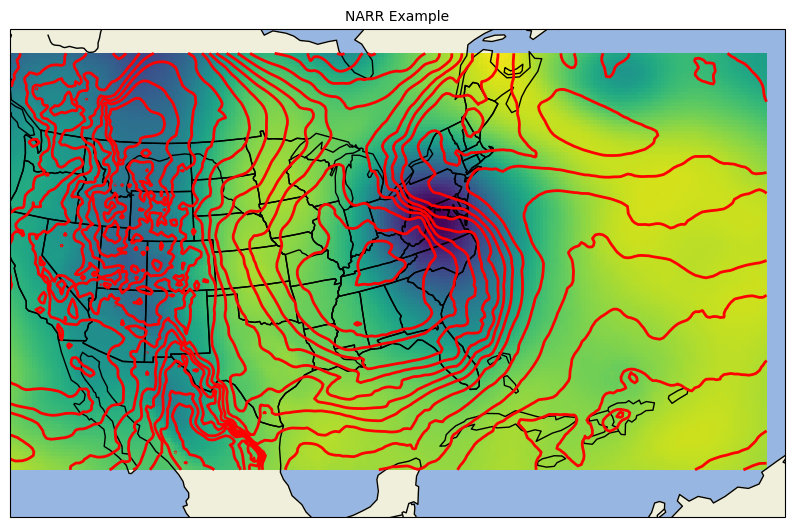
narr = xr.open_dataset(get_test_data('narr_example.nc', as_file_obj=False))Create a contour plot of temperature
contour = ContourPlot()
contour.data = narr
contour.field = 'Temperature'
contour.level = 850 * units.hPa
contour.linecolor = 'red'
contour.contours = 15
Create an image plot of Geopotential height
img = ImagePlot()
img.data = narr
img.field = 'Geopotential_height'
img.level = 850 * units.hPa
Plot the data on a map
panel = MapPanel()
panel.area = 'us'
panel.layers = ['coastline', 'borders', 'states', 'rivers', 'ocean', 'land']
panel.title = 'NARR Example'
panel.plots = [contour, img]

pc = PanelContainer()
pc.size = (10, 8)
pc.panels = [panel]
pc.show()