%matplotlib inline# Copyright (c) 2022 MetPy Developers.
# Distributed under the terms of the BSD 3-Clause License.
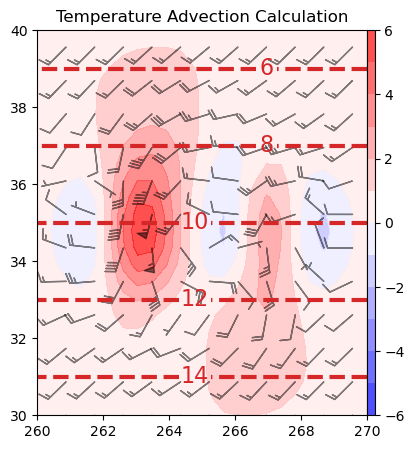
# SPDX-License-Identifier: BSD-3-ClauseAdvection
Use metpy.calc.advection.
This example demonstrates the advection calculation by computing the temperature advection of the example xarray Dataset and plotting using Matplotlib.
import matplotlib.pyplot as plt

import metpy.calc as mpcalc
from metpy.cbook import example_data

# load example data
ds = example_data()

# Calculate the temperature advection of the flow
tadv = mpcalc.advection(ds.temperature, ds.uwind, ds.vwind)

# See the units that come back from the advection function
print(tadv.data.units)

# start figure and set axis
fig, ax = plt.subplots(figsize=(5, 5))

# plot isotherms
cs = ax.contour(ds.lon, ds.lat, ds.temperature, range(4, 26, 2), colors='tab:red',
                linestyles='dashed', linewidths=3)
plt.clabel(cs, fmt='%d', fontsize=16)

# plot temperature advection and convert units to Kelvin per 3 hours
cf = ax.contourf(ds.lon, ds.lat, tadv.metpy.convert_units('kelvin/hour') * 3, range(-6, 7, 1),
                 cmap=plt.cm.bwr, alpha=0.75)
plt.colorbar(cf, pad=0, aspect=50)
ax.barbs(ds.lon.values[::2], ds.lat.values[::2],
         ds.uwind[::2, ::2], ds.vwind[::2, ::2],
         color='black', length=6, alpha=0.5)
ax.set(xlim=(260, 270), ylim=(30, 40))
ax.set_title('Temperature Advection Calculation')

plt.show()
kelvin / second
/var/folders/9w/czmy8vgn76376hx2704_y62w0000gp/T/ipykernel_37512/3945998008.py:10: UserWarning: Vertical dimension number not found. Defaulting to (..., Z, Y, X) order.
  tadv = mpcalc.advection(ds.temperature, ds.uwind, ds.vwind)